TIAUSDT: Gears up to break free from its descending channel! 🌊💎 Paradisers, #TIA could initiate a bullish move if the price bounces and breaks out of the descending channel.
💎If #TIAUSDT bounces and breaks through the descending channel, display a Change of Character (CHoCH) towards a bullish market structure, this would enhance the likelihood of a bullish trend. We could then set our sights on targets up to the next resistance levels.
💎However, if the price breaks down below the bullish Order Block (OB) level, it would be considered bearish. But for now
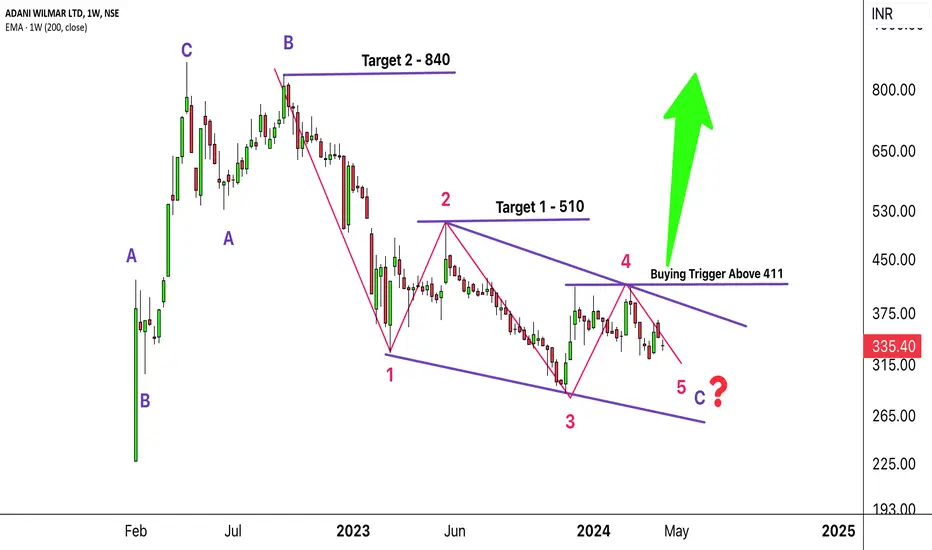
Wedge
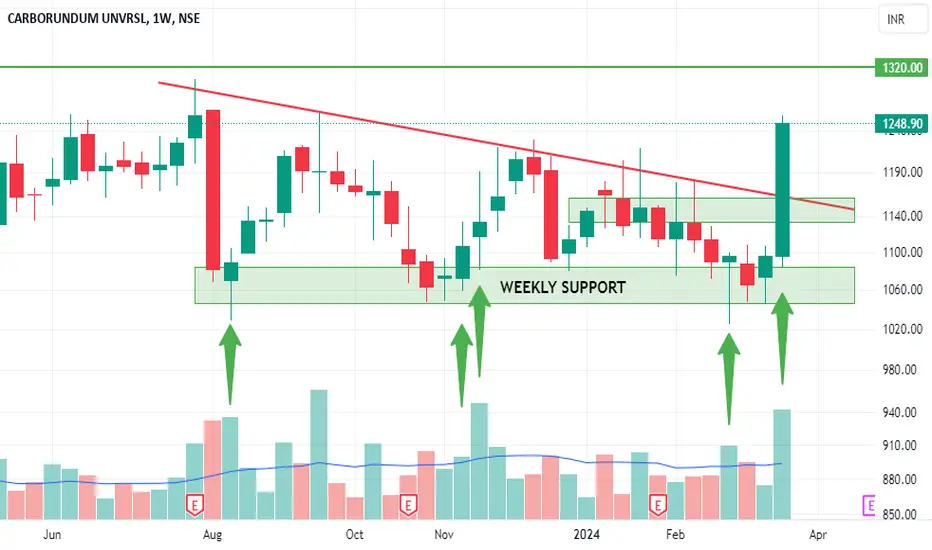
CARBORUNDUM UNIVERSAL - Swing Trade - 23rd March #stocksCARBORUNDUM UNIVERSAL (1W TF) - Swing Trade Analysis given on 23rd March, 2024
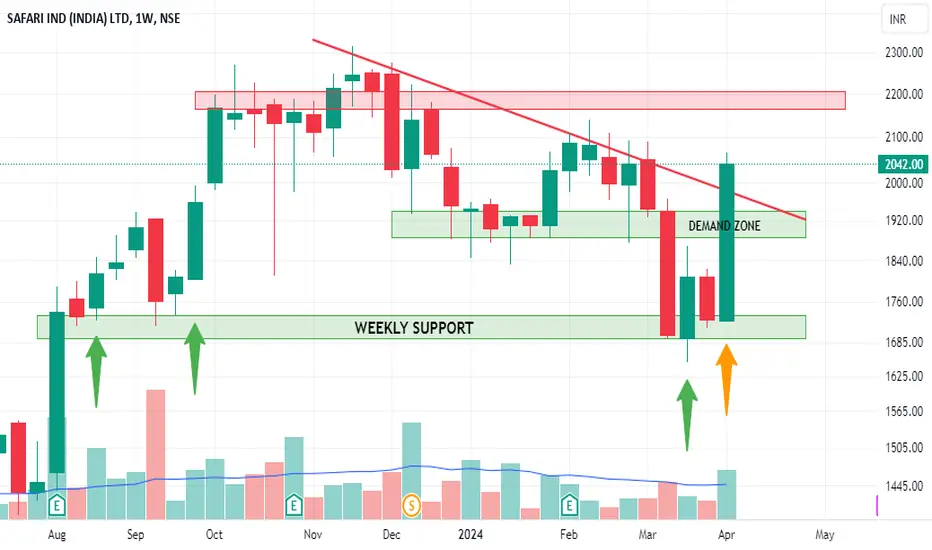
Pattern: FALLING WEDGE BREAKOUT
- Resistance Breakout - Done ✓
- Volume buildup at Resistance - Done ✓
- Demand Zone Retest & Consolidation - In Progress
#CARBORUNDUM
Keep a close eye on WIFUSDT💎💎 Paradisers, #WIF has broken out of the descending channel by forming a 'W' pattern and has displayed a Change of Character (CHoCH) towards a bullish market structure.
💎 If #WIFUSDT successfully breaks above the resistance area, we can anticipate a bullish move. However, a pullback from here is highly probable as the price may need to gather liquidity before advancing.
💎 We can expect a bounce from the bullish Order Block (OB) plus the Demand Zone. For this scenario, confirmation of bullish s
SONATA SOFTWARE - Swing Trade - 14th January #stocksSONATA SOFTWARE (1D TF) - Swing Trade Analysis given on 14th Jan, 2024
Pattern: FALLING WEDGE BREAKOUT
- Breakout - Done ✓
- Volume Spike at Resistance - Done ✓
- Retest & Consolidation - In Progress
#stocks #swingtrade #chartanalysis #priceaction #traderyte #sonatasoftware
TSMC : Bullish - "falling Wedge" and a "BAT" potential.TSMC detection of a "falling Wedge" and a "BAT" potential.
The price could rise and reach the gap upwards towards 147.25 then higher at 156.11
On the downside the market could go down to 135.92 then to 128.76 and finally to 125.27
Additionally, the RSI is divergent with the stock price §
be attentive and monitor the Ichimoku levels
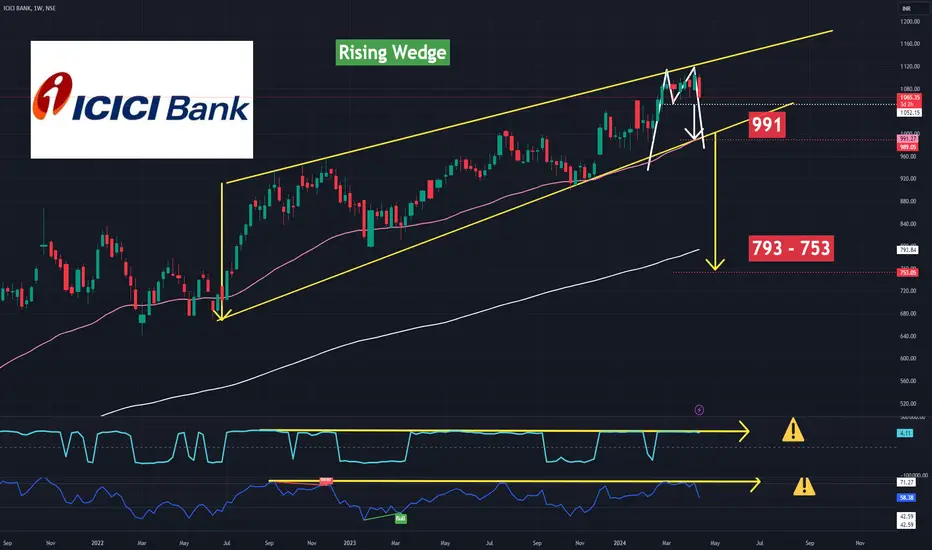
ICICI BANK : Bearish - Rising Wedge detected, and Double TOP ?!ICICI BANK : Bearish - Rising Wedge detected, and Double TOP possible.
To monitor:
The exponential moving averages 50 (in pink) around 991 ,
and the exponential moving average 200(in white) around 793.
A possible Double Top is detected.
+ there are divergences with the RSI and the ROC ( Rate Of Change), which gives the speed of the variation of the momentum of an underlying!
So a bearish return is possible
Be safe!
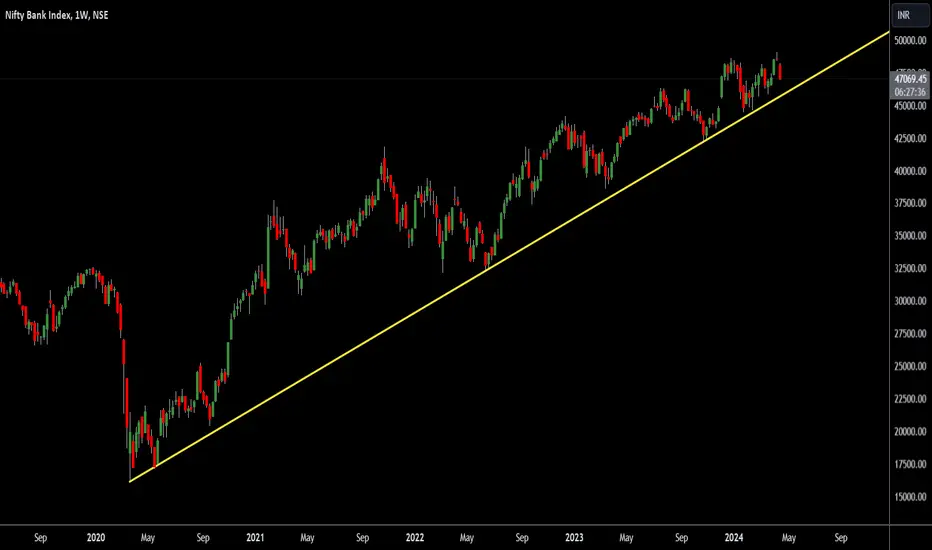
Banknifty ananlysis for tomorrow 15 Apr 24As we discussed, Banknifty's structure opened a gap down and fell.
If we look at the chart now:
The market is making Hammers at the top. Now, the market is in a very crucial position.
It is trading at the support trendline and support zone. The market is making a rising wedge pattern. If the market breaks the pattern to the downside, it will be a good entry for the bearish position.
If we look at the OI data:
PCR = 0.7, which shows neutral market sentiments. However, in the past
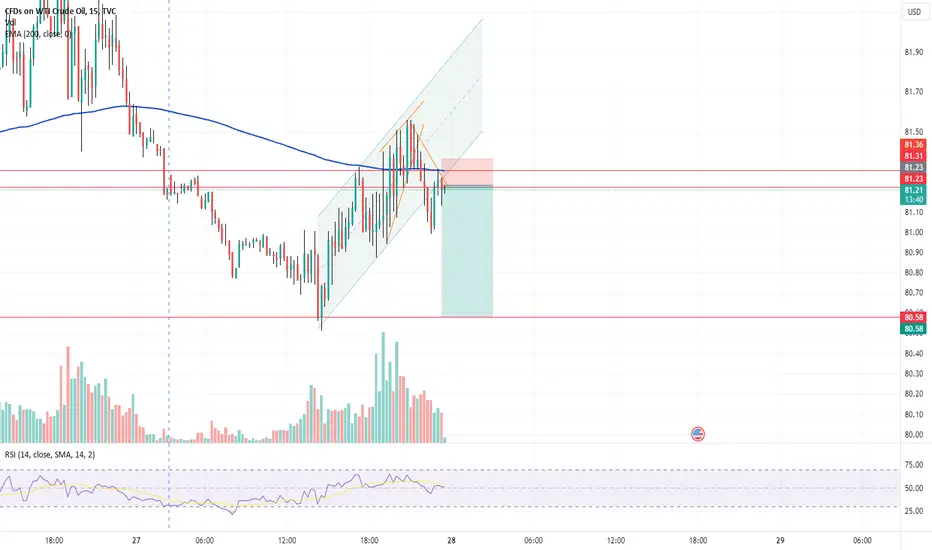
Crude Oil Analysis - Looking Good RR in Down sideCrude oil faces resistance at the 200 moving average after break down rising wedge patern, indicating a potential 1:4 target. Traders may consider this point for planning their positions, keeping the SL in mind.
looking good RR we can take this risk but make sure to cut positon above 200 EMA.
It looks like #API3USDT is gearing up 🚀💎 Paradisers, #API3USDT going to take inner range liquidities by trapping traders through a breakdown of the channel.
💎To confirm this move, we'll need to see CHoCH & BOS indicating a shift towards bullish market structure from the bullish OB.
💎If #API3USDT manages to break above the resistant level, we can anticipate targets being set until the next resistant levels.
💎However, if the price breaks down below the bullish OB or the low, it may be interpreted as bearish. In such instances, it mi
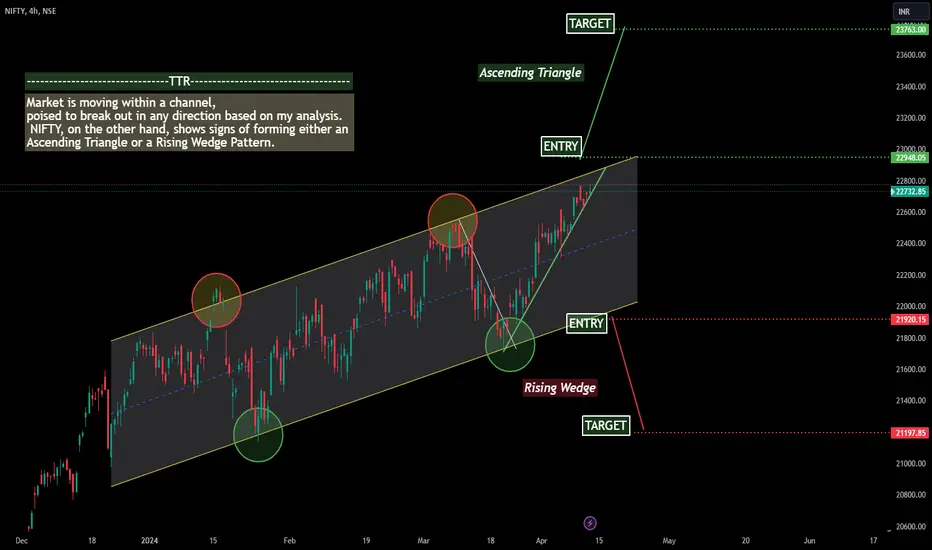
NIFTY April/MAY Direction | Ascending Triangle or Rising Wedge ?Hello Traders/Investors,
After analyzing NIFTY, it appears that a breakout is imminent, either on the upside or the downside.
Patterns:
1. Ascending Triangle | Probability: 70%
2. Rising Wedge | Probability: 30%
Analysis:
1. Ascending Triangle | Upside Potential:
- Condition 1: If NIFTY breaches 22,950 by next week and maintains its position, there's a likelihood of a rally towards 23,760. However, any impact on prices, aside from election results, seems unlikely before then.
- Condition 2
bitcoin down momentum detectedbitcoin down momentum detected
bitcoin breaked a neckline and now trying to retest
now there is a huge chance it will fall a lot for short termseller
grab it with a huge amount
thankyou
bitcoin breaked a neckline and now trying to retest
now there is a huge chance it will fall a lot for short termseller
grab it with a huge amount
thankyou
Devyani analysis Buy activated Devyani International Limited (DIL) is the largest franchisee of Yum Brands in India and is among the largest operators of chain quick service restaurants (QSR) in India. In addition, DIL is a franchisee for the Costa Coffee brand and stores in India.
If we look at the chart:
The stock has broken out to upside. and expected to move higher high.
Reasons:
It has broken Falling wedge pattern to upside. (Bullish)
It has been consolidating for 8 months and now ready to move to upside