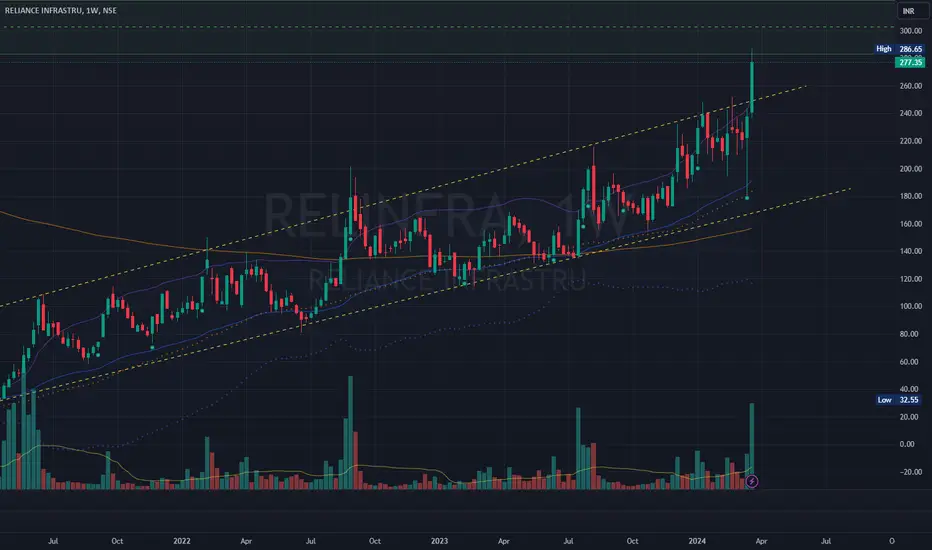
Bullish on Sbi Card Any one who wants to invest in credit card companies can go with sbi card as you see in chart that this share has starts fall from jun 2023 and now almost in ends .
this is trading bet as well as long term for 1 year . . .
this share forms a pattern of falling wedge so accurate
Discalimer:- i am not sebi registered all loss as well as profit both is solely yours . i am not responsbile for any kind of loss or profit solely you are respobile for that .
Wedge
🚀LDO is displaying a bullish market structure 💎 Paradisers, #LDO is currently exhibiting a bullish market structure, supported by the presence of a Bullish Order Block (OB) and a supportive trendline.
💎Should #LDOUSDT demonstrate signs of bullish continuation, such as Change Of Character (CHoCH) or Break Of Structure (BOS) within this key zone, it would serve as bullish confirmation. This could potentially pave the way for further upward movement, targeting the next swing resistance levels.
💎In the event of a pullback, we may anticipate
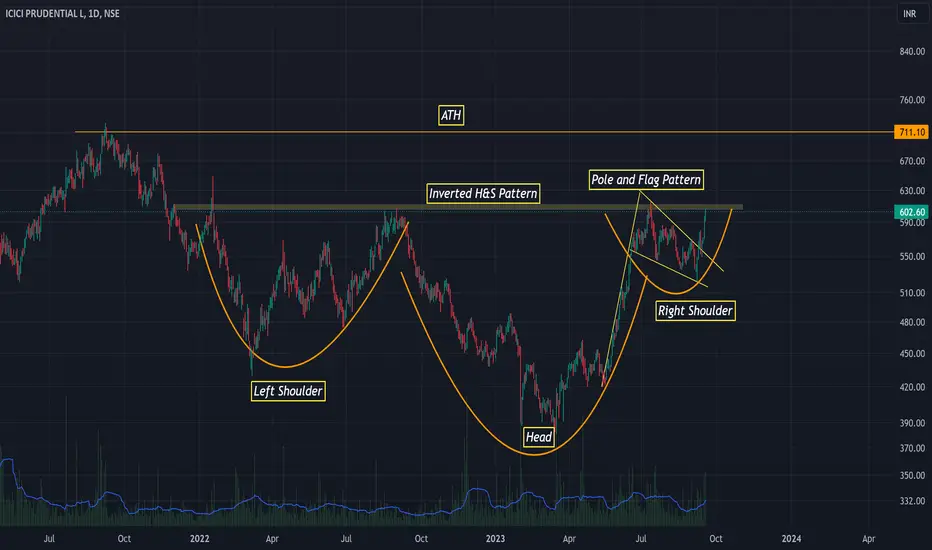
ICICI Pruli:Multiple bullish patterns showing potential growth Stock has made inverted Head and Shoulder pattern on a broader time range and a pole and flag pattern on smaller range after a recent run in Nifty 50.
Stock can move towards its ATH in near time range and can further move to higher levels.
Fundamental remains stronger compared to other stocks in the sector.
View remains bullish for upcoming months.
DISC: For educational purposes only.
BNB COIN BREAKOUT OCCURREDBNB COIN BREAKOUT OCCURRED
BNB showing a strong trendline breaking
So here a good sinario occurred for selling
Sell with a good amount
Never hesitate to sell because it's a strong signal because
1. It's breaked the strong NECKLINE
2. ITS seen rarely in chat it's very difficult to find such trade
Thank you trade safely
Stay happy
BNB showing a strong trendline breaking
So here a good sinario occurred for selling
Sell with a good amount
Never hesitate to sell because it's a strong signal beca
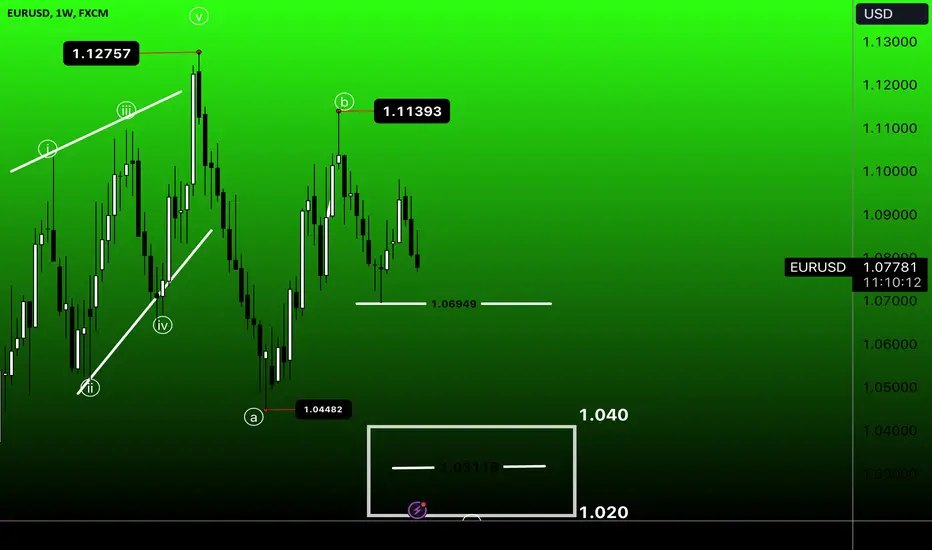
EURUSD Fall - Classic Equality Count in Play | C = A WaveDisclaimer:
Trading in financial markets involves substantial risks. Consult your financial advisor before making decisions. This commentary is not a solicitation to buy or sell.
WaveTalks - Market Whispers!, can you hear them
13th Jan 2024 - B: Wave completed at the tops of 1.11393
Long Term Outlook
From its low at 0.95358, we're seeing a leading diagonal wave signaling a potential long-term uptrend. As previously discussed, big gains might be ahead. Once short term complete
Falling wedge or bullish flag pattern breakoutVolumes in daily and weekly timeframe significantly good.
After breakout significant volume build up on each candle and also broke all time high with good volumes.
Falling wedge or bullish flag pattern breakout successful.
NOTE: I do my analysis, do your before trade.
Link: Waiting for Bullish Confirmation at Key Levels. 🚀💎 LINK is currently approaching its supportive trendline, We can also viewed it as an ascending channel because of above resistive trendline.
💎There's a likelihood of a bounce from this supportive trendline, but I anticipate a potential breakdown of the trendline to capture liquidity down to the bullish order block (OB). Even in this scenario, I'll be waiting for bullish confirmation at both levels.
💎If the price falls and breaks below the bullish OB, it would be considered a Change of Charact
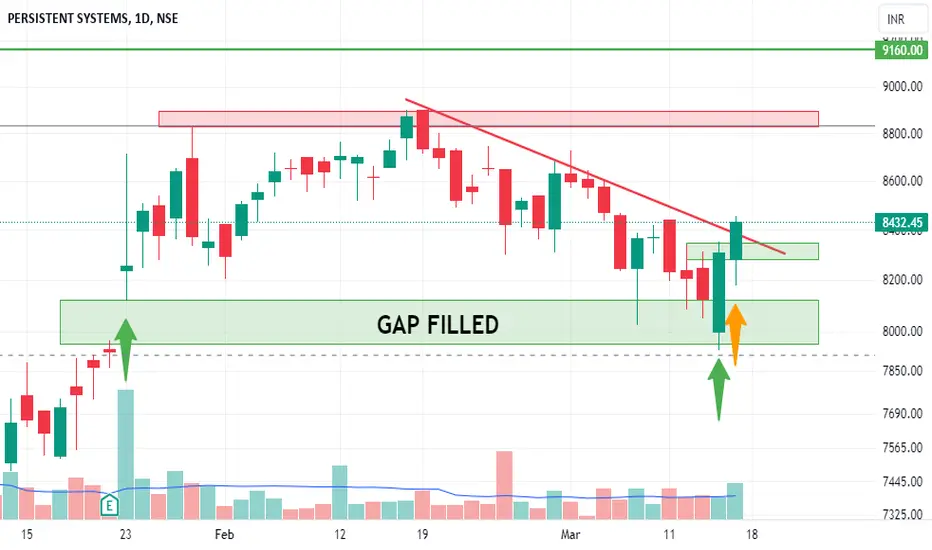
PERSISTENT SYSTEMS - Swing Trade - 17th March #stocksPERSISTENT SYSTEMS (1D TF) - Swing Trade Analysis given on 17th March, 2024
Pattern: GAP FILLED WITH FALLING WEDGE BREAKOUT
- Trendline Resistance Breakout - Done ✓
- Volume buildup at Resistance - Done ✓
- Demand Zone Retest & Consolidation - In Progress
#persistentsystems #niftyit #nifty #swingtrade #midcap
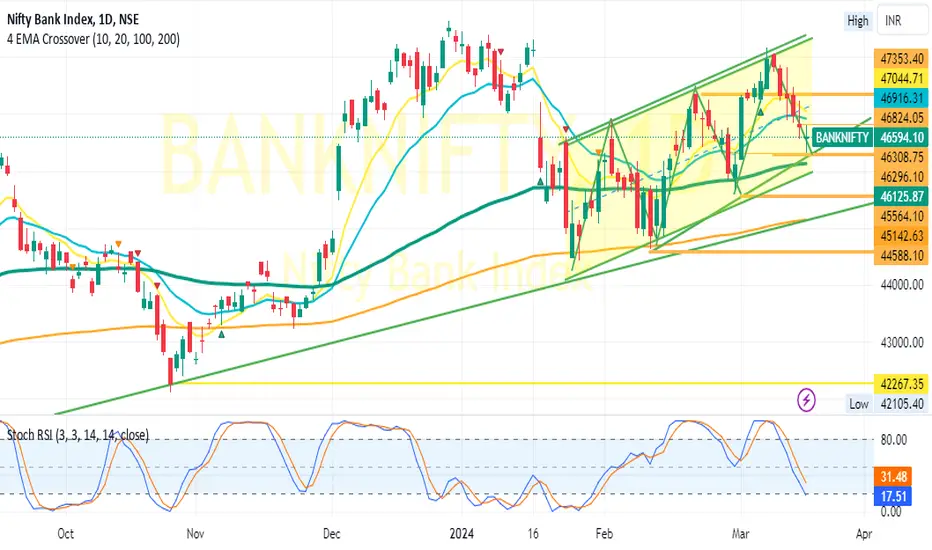
BANK NIFTY-Too seems to be in a weaker teritoryBANK NIFTY: Has already breached all its critical DEMAs and has only its 200DEMA which falls at around 46100 and is acting as the major support. Expect sell on rally till it holds above 47000 comfortably and on a closing basis.On the contrary BNIFTY giving a close below 46000 expect a sharp fall extending to 45500/45000 and below.*(For edicational purpose only)
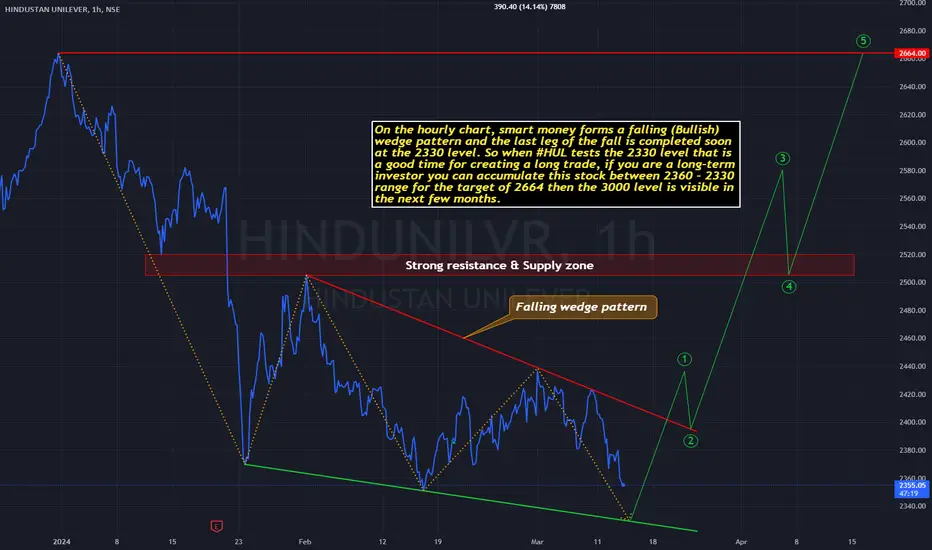
Good time to accumulate this stock. Company:- Hindustan Unilever Ltd.
Sector:- FMCG
M Cap. :- 5.61 Trilion
Technical:- On the hourly chart, smart money forms a falling (Bullish) wedge pattern and the last leg of the fall is completed soon at the 2330 level. So when #HUL tests the 2330 level that is a good time for creating a long trade, if you are a long-term investor you can accumulate this stock between the 2360 - 2330 range for the target of 2664 then the 3000 level is visible in the next few months.
Disclaimer:- Dear trade
ALGO Breakout Alert! Bullish Momentum Detected 🚀💎ALGO has recently broken out of an inverse head and shoulders pattern, accompanied by CHoCH and BOS signals, indicating a shift towards a bullish market structure and increasing the probability of a reversal.
💎If ALGOUSDT breaks above the resistance level and neckline of the inverse head and shoulders pattern, it could suggest further upward momentum, with potential targets extending to the next resistance levels. In the event of a pullback, It will be better to look for a bounce from the bull
TATA POWER CO LTD.Good Buy in TATA POWER
Best buy : In the range of 205-210.
For the Targets of : 215/230/250/280 +++++
Stop Loss : 195
Reason to Buy :
1: Good Support form the Demand Zone of 200-205
2: Break out of Falling wedge pattern.
3: Good Risk to Reward Ratio.
Thanks
Note:
This idea is only for the Educational purpose. Tarde at your own Risk.
If you like the idea plz do like & support.