U
 Long
Long
 Long
Long
Gala: Bullish Reversal Ahead! Watch for Breakout Confirmation 🚀💎 GALA has recently broken out of a descending channel and formed a cup and handle pattern, indicating a potential bullish reversal. Additionally, the price has exhibited signs of CHoCH (Change Of Character) and BOS (Break of Structure), further supporting the bullish market structure and increasing the likelihood of a bullish move.
💎If GALAUSDT manages to break above the resistance level, it would confirm the cup and handle pattern and could lead to a bullish continuation towards the next resistance level. In the event of a pullback, we can anticipate a bounce from the bullish OB (Order Block), especially if accompanied by bullish candlestick patterns, which would provide confirmation of the bullish bias.
💎However, if the price exhibits sharp declines with significant red candles, it would be prudent to exercise caution and wait for better price action confirmation before considering entry, as this could indicate a potential reversal or market uncertainty.
 Long
Long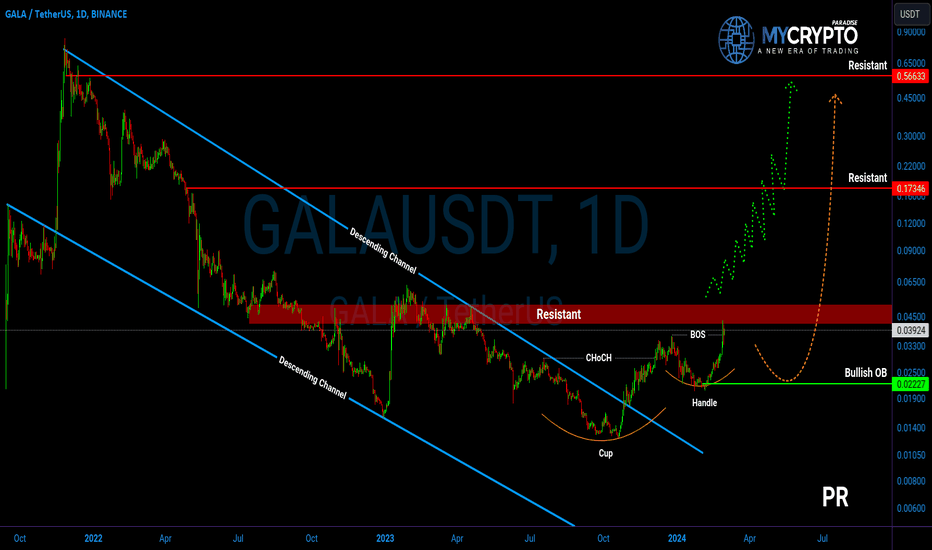
 Long
Long
OGN: Bullish Breakout Signals Potential Upside! Watch Key Levels💎 OGN has broken out of a descending channel, accompanied by the formation of an inverse head and shoulders pattern, indicating a shift towards a bullish market structure. Additionally, there's evidence of a Change of Character (CHoCH) in the price, further supporting the bullish sentiment.
💎If OGNUSDT manages to break above the first resistance zone, which also coincides with the neckline of the inverse head and shoulders pattern, we can anticipate a bullish movement towards the next resistance levels. In the event of a pullback, if the price retraces to the bullish OB (Order Block) and demonstrates bullish candlestick patterns, it could signify a potential bounce from that level.
💎However, if the price breaks down below the demand area, it would be prudent to exercise caution and consider ignoring OGNUSDT. This decision is based on the broader bullish sentiment prevailing in the overall market, coupled with the upcoming halving event. If OGN's price declines amidst a bullish market backdrop, it may suggest underlying weaknesses, making it less attractive for trading or investment purposes.  Long
Long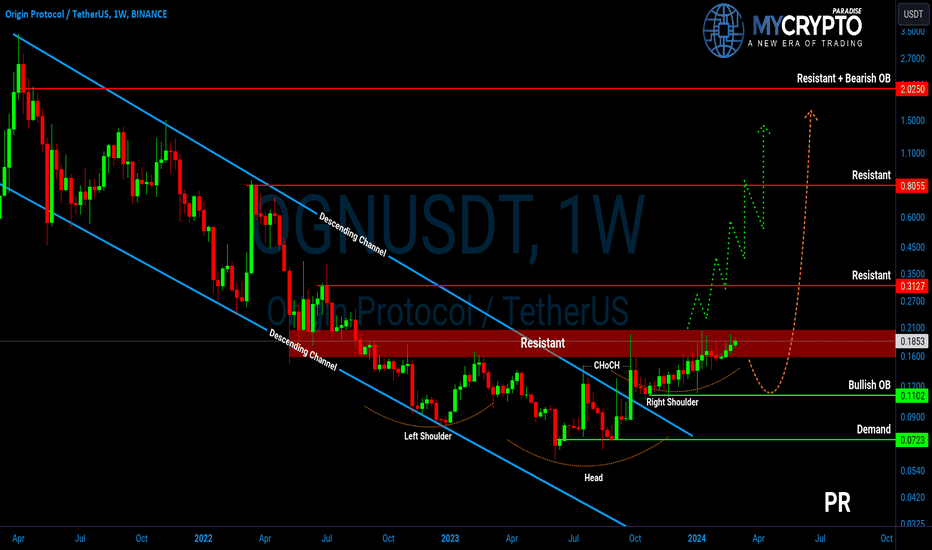
 Long
Long
 Long
Long
 Long
Long
CVX: Bullish Breakout Imminent! Keep Watch for Confirmation 💎 CVX has recently broken out of a descending channel, indicating a potential shift towards bullish momentum, especially with the formation of a W pattern and the presence of CHoCH, signaling a change in character towards a bullish structure.
💎Currently, the price is approaching a resistance level. If CVX manages to break above this resistance, it could signal further bullish movement. Conversely, if there's a pullback, traders may anticipate a bounce from the bullish Order Block (OB), which also acts as a demand area.
💎However, it's essential to be cautious if CVX experiences panic selling and breaks below the bullish OB. In such a scenario, it may be prudent to avoid trading CVX until clearer market conditions emerge.  Long
Long
 Long
Long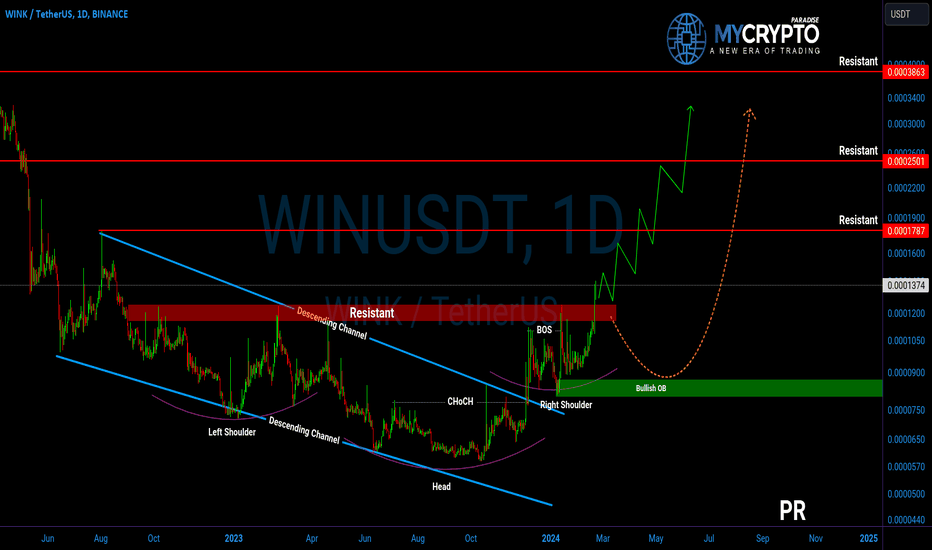
 Long
Long
 Long
Long
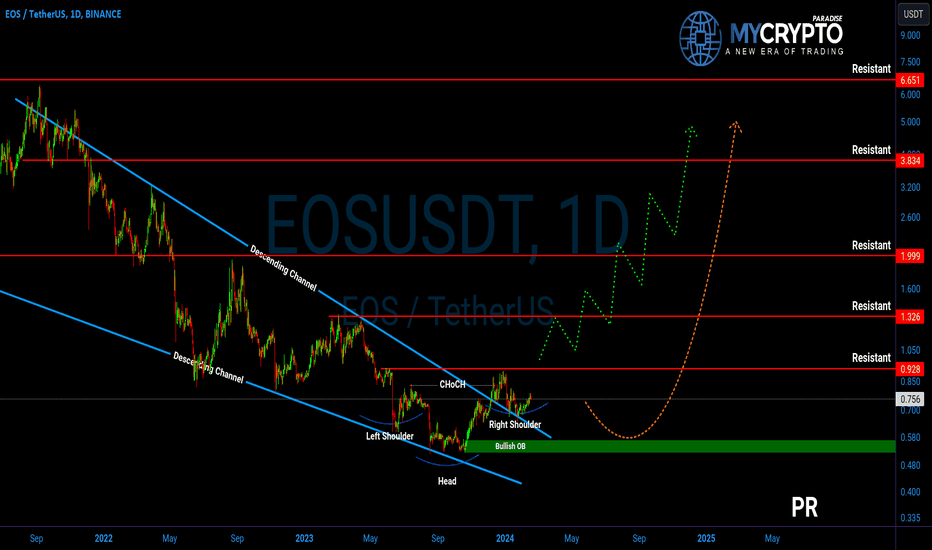
EOS: Bullish Reversal Alert! Breakout Potential Ahead💎 EOS has recently broken out of the descending channels and formed an inverse head and shoulders pattern, which typically indicates a bullish reversal. Additionally, there has been a noticeable change of character (CHoCH) in the price action, suggesting a shift from a bearish to a bullish structure.
💎To confirm the bullish trend, it is essential for the price to break out above the first resistance level. This breakout would signal potential targets towards the subsequent resistance levels.
💎In the event of a pullback, if the price forms bullish candlestick patterns around the bullish Order Block (OB) levels, it could provide further confirmation of a bullish bounce.
💎However, if the price breaks down below all of these levels, the pattern would become invalid, indicating a potential shift back to a bearish structure.
💎Traders should closely monitor the price action of EOS, particularly around the resistance and OB levels, to gauge potential trading opportunities and adapt their strategies accordingly based on the prevailing market dynamics. E
NIFTY prediction for tomorrow 16th FEB 24As we discussed NIFTY for today, it ended sideways.
Now, if we look at the chart data:
The market has already given a breakout as it expired today. It ended sideways to the upside while facing resistance at 21950. The market will be sideways in the range of 21800-21950.
EMA has given bullish-crossover EMA(50,200). Which shows the market is in a good bullish phase.
If we look at the OI data:
Pcr = 0.96 shows a bullish signal. Also, 21900 has very good PE writing, which shows it's going to provide good support. On the upper side, there is good resistance CE writing at 21900, 21950, and 22000. that will provide nice resistance.
FII & DII have yet to be released.- I will update you in the comments.
The market should be sideways in the range of 21800-21950. if it breaks 21950 to the upside, I can expect a good bullish momentum till 22110, as has been marked in the chart.
Reasons:
Price > EMA(13,50,200) which shows nice bulls power.
EMA golden crossover EMA(50,200) shows bullish trend.
RSI ~ 60 but sideways with bullish divergence, which shows the market can move to the upside.
OI data Pcr = 0.96 shows bulllish market sentiments.
Price ~ VWAP, which shows market price and volume both are balanced. The market has a good range to go upside down.
Verdict:
Sideways in the range 21800-21950.
Bullish if it breaks 21950 to the upside.
Plan of Action:
Iron condor in range(21800-21950)
if it breaks to the upside, add a bullish position and exit a short position.  Long
Long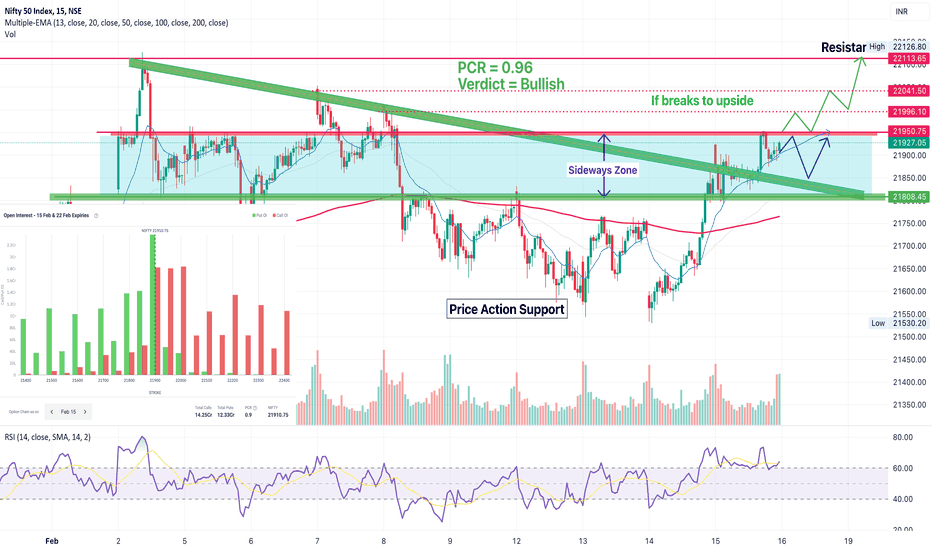
 Long
Long


