Bank Nifty - Up, Up & Away ( 1000+ points) -Move RepeatsDisclaimer:
Trading in financial markets involves substantial risks. Consult your financial advisor before making decisions. This commentary is not a solicitation to buy or sell.
WaveTalks - Market Whispers: Can you hear them?
Bank Nifty went up again, just like before, this time 1000+ points today 31st Jan 2024. It went down a bit first to 45071, retracing 50% of 44429 to 45660 upside move as expected & gave second buying opportunity & then shot upside holding true to our expectati
Wedge
ZENTEC - Continuation Wedge (Bullish) Pattern A "Continuation Wedge (Bullish)" chart pattern formed on Zen Technologies Ltd ( NSE:ZENTEC ).
This bullish signal indicates that the stock price may rise from the close of 742.15 to the range of 842.00 - 920.00.
Supportive Points:
-After a temporary interruption, the prior uptrend is set to continue.
-Also there was a gap on 7th Aug 2023 which was filled on 26th October 2023.
-Pattern formation took roughly 71 days, so target will be sooner or later than 71 days.
-FII has Increased Qty - Y
VARDHAMAN TEXTILES - SWING TRADE - 11th January #stocksVARDHAMAN TEXTILES (1D TF) - Swing Trade Analysis given on 11th Jan, 2024
Pattern: FALLING WEDGE BREAKOUT
- Breakout - Done ✓
- Volume Spike at Resistance - Done ✓
- Retracement & Consolidation - In Progress
#stocks #swingtrade #chartanalysis #priceaction #traderyte #vtl
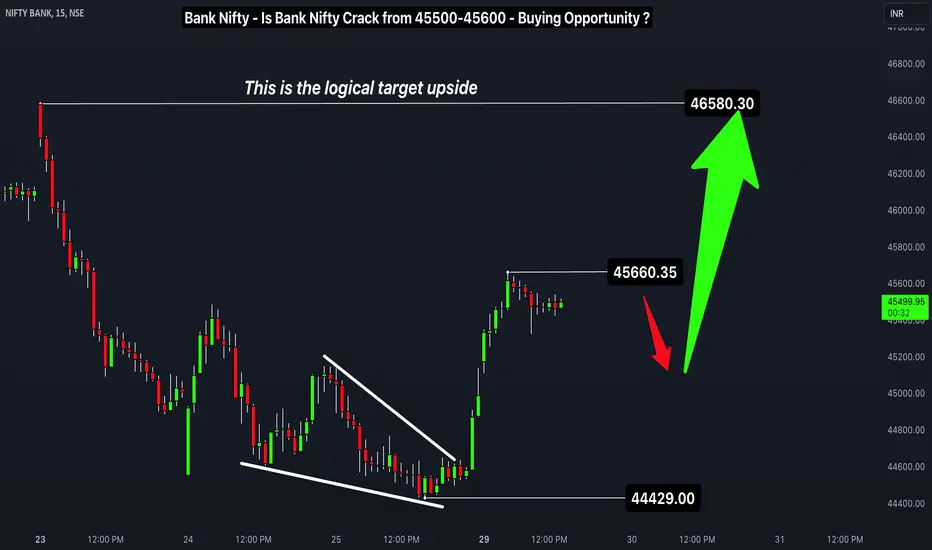
Bank Nifty-Post Wedge Crack from 45500-600 - Buying Opportunity?Disclaimer:
Trading in financial markets involves substantial risks. Consult your financial advisor before making decisions. This commentary is not a solicitation to buy or sell.
WaveTalks - Market Whispers: Can you hear them?
As discussed over the HDFC Idea
Got an explosive upside move in Bank Nifty & pattern looks to be terminated downside with a falling wedge.
Post wedge- Bank Nifty jumped 1231 points appx. As updated recently we were looking for 1500+ points as logical targe
SBI CARDS - Swing Trade - 28th January #stocksSBI CARDS (1W TF) - Swing Trade Analysis given on 28th Jan, 2024
Pattern: FALLING WEDGE
- Volume Spike at Resistance - Done ✓
- Breakout - In Progress
- Retest & Consolidation - In Progress
#stocks #swingtrade #chartanalysis #priceaction #traderyte #SBICARDS
Petronet LNG: Bullish Pattern formationNSE:PETRONET is showing an interesting breakout pattern.
It is breaking out a pennant pattern formed since last 3 yrs with an excessive high volume.
Structure wise it is also creating an higher high patten.
Lets wait for the price to correct upto it's support level of 240. Then its a good price to acquire for a potential price target of 300. SL can be kept at 210.
SIS Ltd-DO NOT MISS!SIS is a stock which is looking very beautiful for a range breakout with a falling wedge pattern.
If the stock closes above 500 tomorrow, we will have a breakout and retest completed.
Stock might outperform markets and is a very safe bet.
Levels mentioned in chart. I am expecting bigger targets than ATH.
Stock is available at an amazing valuation.
KAYNES - SWING TRADE - 14th January #stocksKAYNES (1D TF) - Swing Trade Analysis given on 14th Jan, 2024
Pattern: FALLING WEDGE BREAKOUT
- Breakout - Done ✓
- Volume Spike at Resistance - Done ✓
- Consolidation & Upmove Candle - Done ✓
#stocks #swingtrade #chartanalysis #priceaction #traderyte #kaynes
Continuation Wedge - Bullish PatternA continuation wedge , is a technical analysis pattern found in daily chart of MTARTECH.
Let's delve a bit deeper into the components and dynamics of this pattern.
Bullish Continuation Wedge:
Shape and Structure:
Trendlines: A bullish continuation wedge consists of two converging trendlines that slope downward against the prevailing uptrend. These trendlines create a narrowing price range, forming a wedge shape.
Market Psychology:
Temporary Interruption: The wedge pattern represent
Jupiter Wagons Ltd forms bullish "Continuation Wedge" "Continuation Wedge (Bullish)" chart pattern formed on Jupiter Wagons Ltd ( NSE:JWL ).
This bullish signal indicates that the stock price may rise from the close of 309.50 to the range of 348-380.
The pattern formed over 37 days which is roughly the period of time in which the target price range may be achieved.
PLEASE NOTE THAT:
This chart analysis is only for reference purpose.
This is not buying or selling recommendations.
I am not SEBI registered.
Please consult your financi
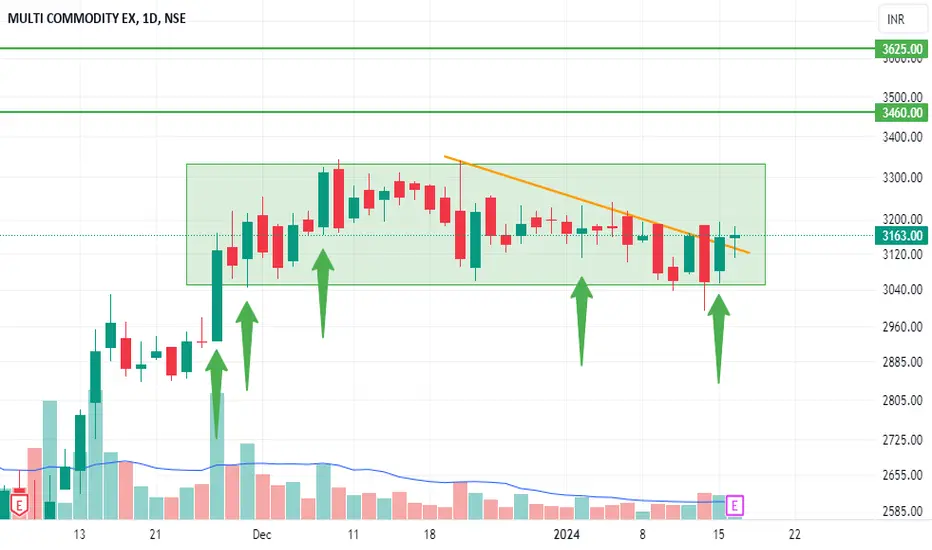
MCX - SWING TRADE - 16th January #stocksMCX (1D TF)
Swing Trade Analysis given on 16th Jan, 2024
Pattern: FALLING WEDGE BREAKOUT
- Breakout of Resistance - Done ✓
- Volume Spike Buildup at Resistance - Done ✓
- Retracement & Consolidation - In Progress
#stocks #swingtrade #chartanalysis #priceaction #traderyte #MCX
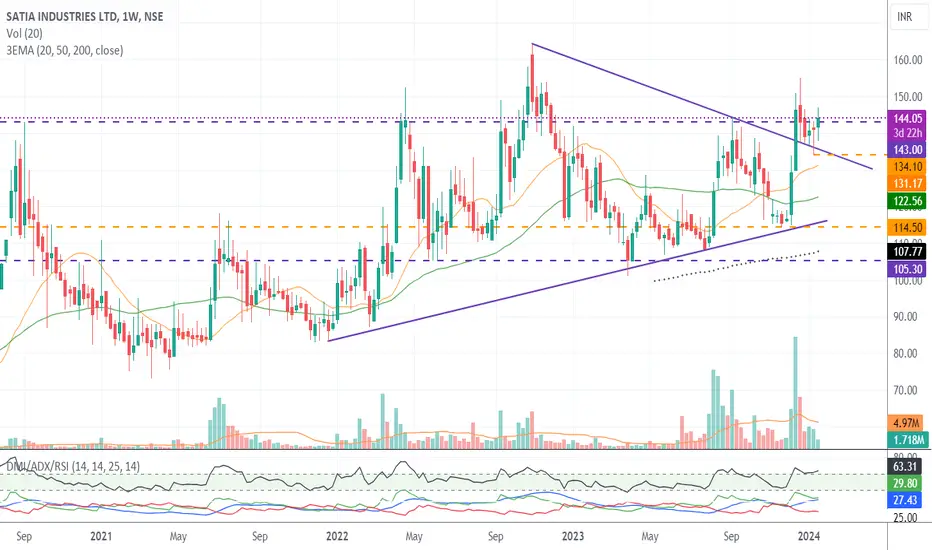
SATIA INDUSTRIES, Fast growing but still Undervalued Paper stockSATIA Industries is looking good on weekly chart...
CMP 145..
Chart attached shows good position building..
Its a weekly chart and candle is not closed, So I am kind of preempting further move.
SL below 131 DCB for short term trade, and 114 for positional/medium term trade.
Fundamentals are very good for this company and hugely undervalued.
CWIP+Just completed expansion will contribute to more than 20% in next year's revenue...
PE is just 6 and intrinsic value of more than 360 as per screener.
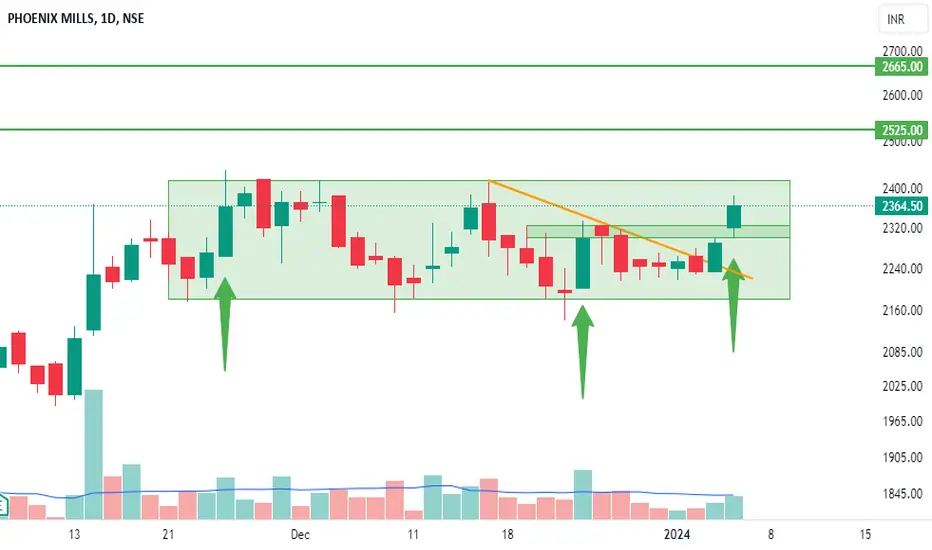
PHOENIX LTD - SWING TRADE - 5th January #stocks#PHOENIXLTD (1D TF)
Swing Trade Analysis given on 5th January, 2023
Pattern: FALLING WEDGE PATTERN
- Volume Spike Buildup - Done ✓
- Breakout of Resistance - Done ✓
- Box breakout + Retracement & Consolidation - In Progress
#stocks #swingtrade #chartanalysis #priceaction #phoenixltd
POLYCAB : Bottoming out very soon Exciting Bullish Pattern Alert! 🐂
📊 Pattern: Rising Channel
📌 Symbol/Asset: POLYCAB
🔍 Description: Stock is around the support of Rising Channel.
Stock also completed its bearish target around 3700-3800
We can see stock bottming out near 3700- 3800
👉 Disclosure: We are not SEBI registered analysts, this is not a buy or sell recommendation.
TTML - SWING TRADE - 19th December #stocksTTML (1D TF)
Swing Trade Analysis given on 19th December, 2023 (Tuesday)
Pattern: FALLING WEDGE BREAKOUT
- Falling Wedge Breakout + Consolidation - Done ✓
- Neckline Breakout - Done ✓
- Volume Spike- Done ✓
#stocks #swingtrade #chartanalysis #priceaction #traderyte #ttml
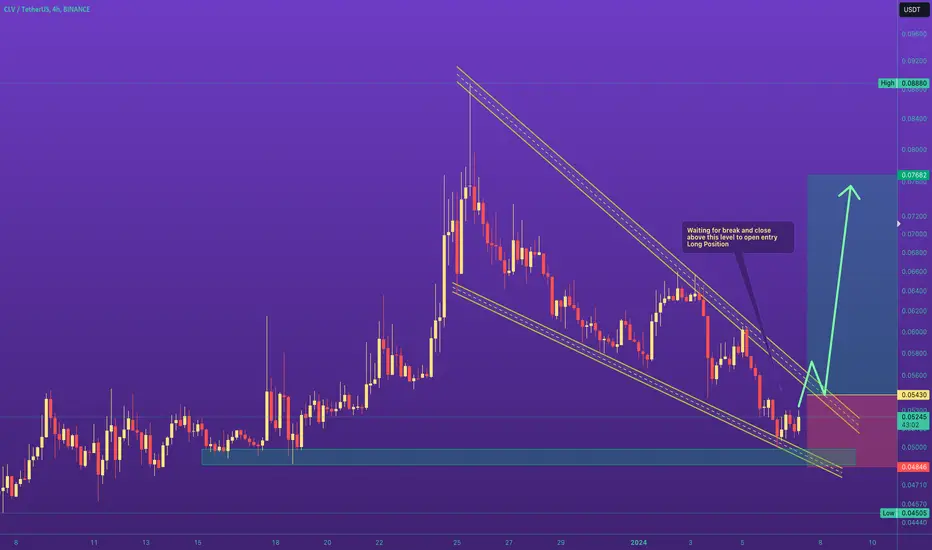
Accumulation Phase then Big move will happen | Long BiasOn 4H TF
CLV is in #FallingWedge and moving down to lower line of the pattern
So I think CLV will be explosive after breakout of falling wedge
Wait for true breakout and retest to catch this trend
Time will tell
CLong