Breakout for EPL ( Falling Wedge Bullish Pattern)Price has formed a falling wedge pattern If it closes above 195, targets are 200, 207, 213.Longby Maverick_TradingUpdated 3
Axis bankPrice has formed a rising wedge and the consolidation is getting narrow. Pattern : Wedge. Range : Medium. Trend strength : Normal. Buy Above : 994. Stop Loss : 989 Targets : 999, 1004 and 1010. Sell below : 985. Stop Loss : 990. Targets : 980, 975 and 970. Price in one hour time frame. Check the live market updates. Hit the like button to Rock !! Show some energy !! Note : This is my pre market analysis and my trading journal. Not a suggestion to buy or sell. You are responsible for whateveby vanathiUpdated 12
BANKNIFTY November 8, 2023BankNifty turns bullish as expected! On November 7th, NSE:BANKNIFTY broke through neckline resistance with a bullish momentum candle, confirming the bullish trend that we have been anticipating. The weekly chart shows a rising wedge formation, which could lead to a short-term bullish trend, with BankNifty breaking through 45,000 and reaching an all-time high before reversing. I have plotted and adjusted support and resistance levels on the chart. Please watch the market closely and tradeLongby UnknownUnicorn346287341
Finnifty - Nov 7Price is moving up for the past few days, but the width is narrowing in the form of rising wedge. So you should be careful as it may fall suddenly. Buy above 19660 with the stop loss 0f 19610 for the targets 19700, 19740 and 19820. This will happen if the price retains the bullish strength. Sell below 19570 with the stop loss of 19610 for the targets 19530, 19490, 19450 and 19400. The fall may be more if the price gains bearish strength. Support zone : 19420 - 19460. Resistance zone : 19790 by vanathiUpdated 311
At inflection point.Nifty is at inflection point. Macro narrative has turned positive while techinically, its nifty is retesting neckline of head and shoulder Wait and watch.by MacroCow0
Triple bottom done don't missI'm very positive on this company, actually it's infrastructure gas companies. It's my long term investment at least 5 years time frame Yesterday it's results came & also provide conference to share my idea As per t. A. Folling wedge petern form in daily charts Today we can see break out GLongby MurtazaLokhandwala17
clear move to up site ready to breakout but some time stay 750 to 650 one day ya 2 day now check good movemenet start Longby VikkasWealthGrid1
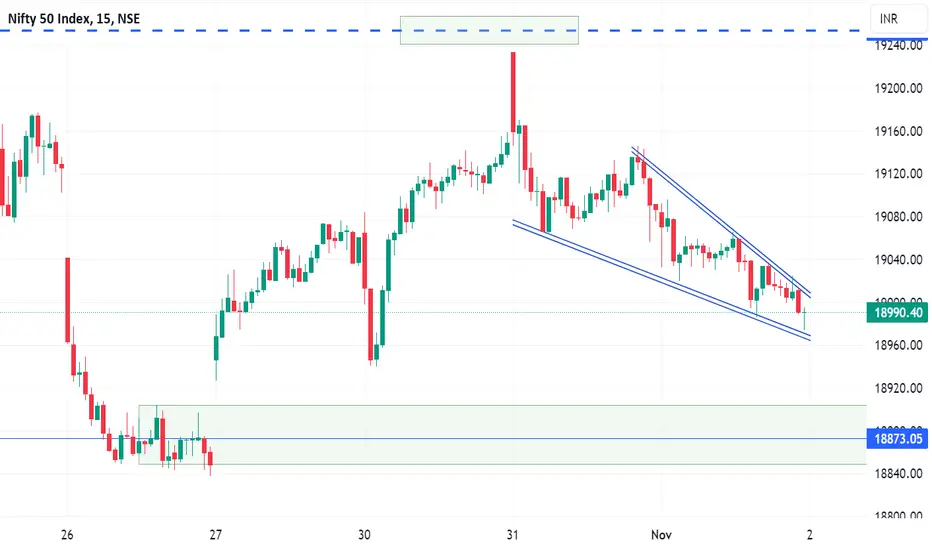
Nifty weekly expiry for 02/11/23.Nifty has formed a red candle on the daily charts and is trading between both the moving averages. It is showing a bearish trend on smaller time frame, also forming a fall wedge pattern. If the market starts trading below 18900, there will be a huge sell off as the low will be cleared and support will be around 18720. On the hourly charts, the market has been trading below the moving averages which signify some negativity. Support :- 18870, 18720 Resistance :- 19250, 19400 Tomorrow is weeklby TheMamboMomentum1
NIFTY positional - 1000 pts move NIFTY index on a weekly timeframe, a notable diamond top formation seems to be developing. Historically, diamond patterns have often signaled significant price reversals. Based on this observation, a potential 1000 pts move could be on the horizon. Analysis: Diamond Top Formation : The diamond pattern, often considered a reversal formation, has manifested after NIFTY's bullish run. This pattern encapsulates a period of market indecision, with the price oscillating within converging trendlineShortby msk_analysisUpdated 27
🚨 #BankNifty Weekly Time Frame: What's Next? 🚨NSE:BANKNIFTY On the weekly chart, there's a huge rising wedge shaping up for BankNifty. This week, we've tapped the trendline again. The weekly candle has got a significant wick at the bottom, showing buyers are still in the game. 📈 Support Zone: 41800-42000 Resistance Zone: 43800-44000 A drop below 41800 might kickstart a bearish run. Or, we could consolidate in this zone and see some sideways action before the next big move. Keep your eyes peeled for a breakout or a bounce back!by TrendTechnician1
Trendline breakout on weekly chartWedge pattern formation on the weekly chart. Close above 665 will be considered as a breakout. BUY - 665, SL - 620 NOTE:- Please maintain good risk to Reward, as per your risk appetite. Longby LearnerSujitCUpdated 4
Wedge Pattern breakout on weekly chart of VOLTASLooks like Voltas may break the wedge on the weekly chart. Buy above - 833, SL - 794 NOTE:- Please maintain good Risk to Rewards as per your risk appetite. Longby LearnerSujitCUpdated 7
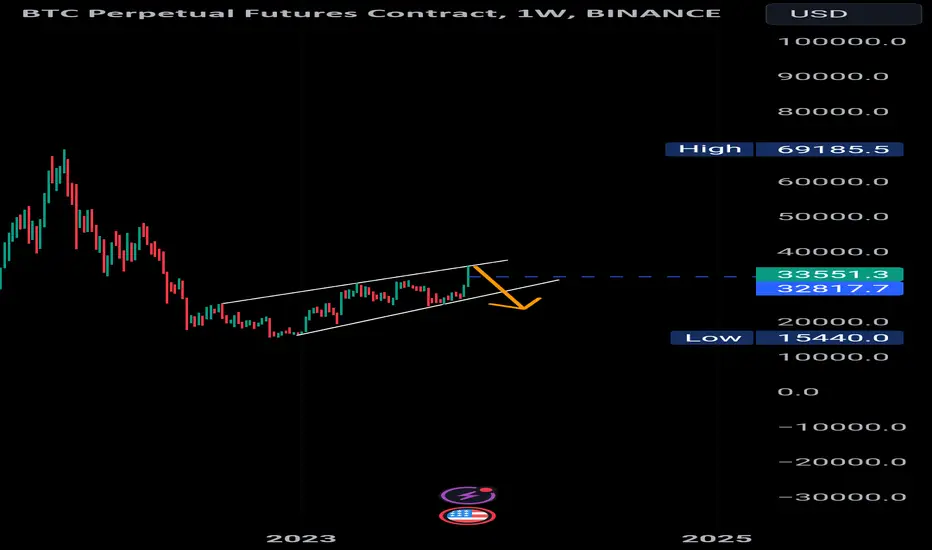
BTC FORMED RISING WEDGEBTC clearly formed rising lot of chances to get get short becoz of whole liquidity , so need to clear lower liquidity which is buy side. SUPPORT LEVELS : 26000 TO 24500, 20000 TO 19500 & 15000 to 16000$Shortby crypto_vulture_signals0
HDFCLIFE, 15min Falling Wedge BOFalling wedge BO in 15 min TF Entry : 625 Target : 631/637 SL : 619 RR : 1 /. 2Longby Safwan65Updated 4
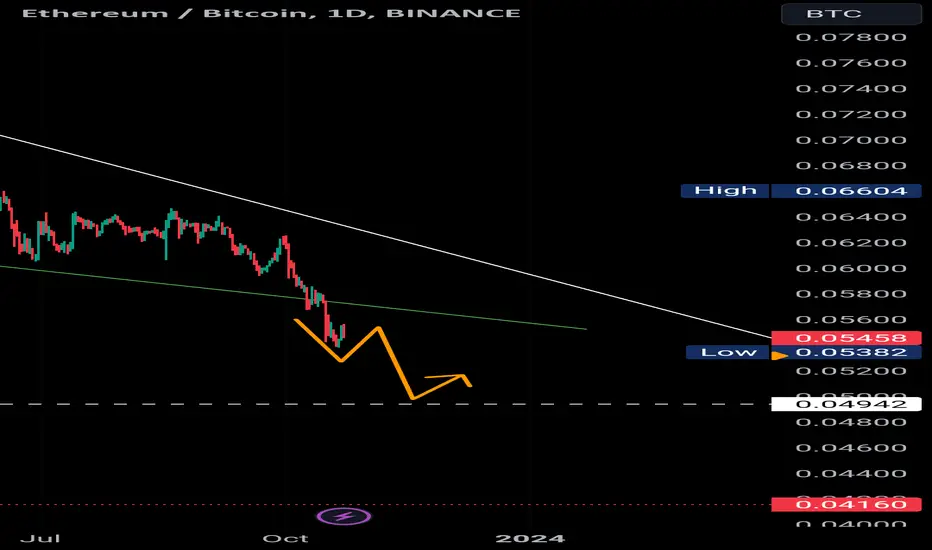
ETHBTC LOST SUPPORT ETHBTC LOST falling wedge support and wating for to find next support. BTC.D breakout and rises. ETH will move slowly by crypto_vulture_signals0
Mighty Nifty - Oct 19Pattern : Falling Wedge. Range : Medium. Trend strength : Normal. Buy Above : 19640. Stop Loss : 19610. Targets : 19680, 19720 and 19750. Sell below : 19560. Stop Loss : 19590. Targets : 19530, 19500 and 19460. Expiry day range is 19450 to 19750. Check the live market updates. Hit the like button to Rock !! Show some energy !! Note : This is my pre market analysis and my trading journal. Not a suggestion to buy or sell. You are responsible for whatever you do.by vanathiUpdated 34
A Continuation Wedge (Bullish) pattern in ARVINFASN A Continuation Wedge (Bullish) is a technical chart pattern often observed in financial markets, particularly in price charts of stocks, currencies, commodities, and other assets. This pattern is characterized by its appearance during an uptrend and signifies a temporary pause or consolidation before the prevailing uptrend resumes. Here's a breakdown of its features and implications: Pattern Appearance: The Continuation Wedge (Bullish) consists of two converging trendlines, both of which by hardeepssethiUpdated 3
Accumulation of Vakrange(Nifty small cap) Vakrangee accumulating for past 7 months. Almost 130 bars of accumulation Volume is slowly building up. 50 EMA very close to 100 EMA in day chart.Safe to take entry at crossover Touched the trendline and gave a slight rise with a not so bad volume. May come to 16 range if trendline brocken downwards. Short term target : 25 Long term : 45 SL : 14 Better to add in steps.(At EMA crossover) Longby mfasilkvUpdated 130
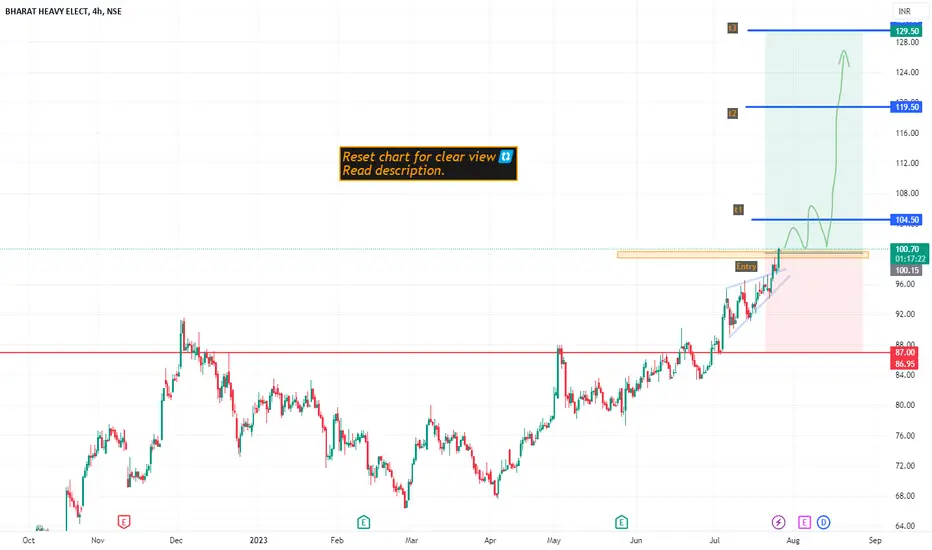
BHEL ltd,.; min 30% Return ; right time to investFundamentally good stock, For long term investment. . . Entry: 102 target: 104 -119 - 130 sl: 97 major stoploss/ support: 87 . Enter only after breaking & close above " Yellow box" mentioned. Or else wait for some time. ' ;good for long term investment. ' ' Don't make complicated trade set-up.📈📉 Keep it " simple, focus on consistency 💹 Refer our old ideas for accuracy rate🧑💻 Valuable comments are welcomed-✌️ . refer old ideas attached belowLongby TheNuraTradingUpdated 363
EQUITASBNK - Continuation Wedge (Bullish)Daily chart analysis of EQUITASBNK tells me that following a brief pause, the previous upward trend is poised to resume. A Bullish Continuation Wedge illustrates a momentary pause in an ongoing upward trend, characterized by two converging trendlines that both slope downward against the prevailing trend. Throughout this phase, there's a struggle between bearish and bullish forces, with bears attempting to gain control over bulls. Eventually, the bulls emerge victorious, as evidenced by a deby hardeepssethiUpdated 2
Bank Nifty - Oct 9Pattern : Wedge. Range : Medium Trend strength : Normal Buy Above : 44520. Stop Loss : 44440. Targets : 44600, 44720, 44800 and 44960. Sell below : 44300. Stop Loss : 44380. Targets : 44220, 44100, 44020, 43920 and 43840. Check the live market updates. Hit the like button to rock !! Note : This is my pre market analysis and my trading journal. Not a suggestion to buy or sell. You are responsible for whatever you do.03:10by vanathiUpdated 218
Mighty Nifty - Oct 9Pattern : Wedge. Range : Medium Trend strength : Good. Buy Above : 19720. Stop Loss : 19690. Targets : 19760, 19790 and 19820. Sell below : 19620. Stop Loss : 19660. Targets : 19580, 19540, 19500 and 19460. Check the live market updates. Hit the like button to Rock !! Show some energy !! Note : This is my pre market analysis and my trading journal. Not a suggestion to buy or sell. You are responsible for whatever you do.by vanathiUpdated 29
FSL Falling wedge breakout dponeFSL Falling wedge breakout done can look for tp of 160-170 Longby mdamin786Updated 10
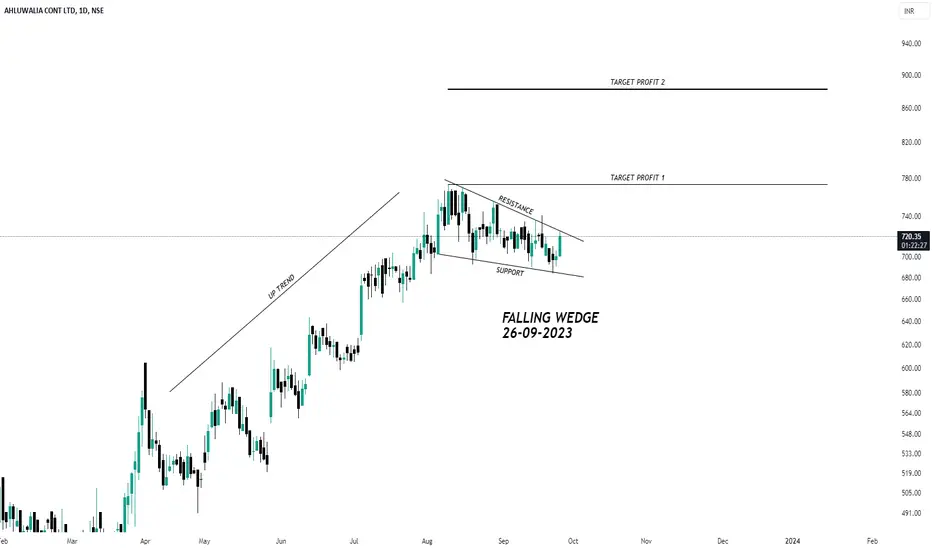
AHLUCONT Trade set up with falling wedge1. Trend - Bullish 2. Pattern - POLE & Flat & falling wedge 3. Breakout yet to be confirmed 4. RR is lucrative more then 1:5Longby KamalKJoshi0
 LongLong

 Long


 LongShort
 Long
 Long
 Short
 Long


 Long
 Long

 Long
 Long