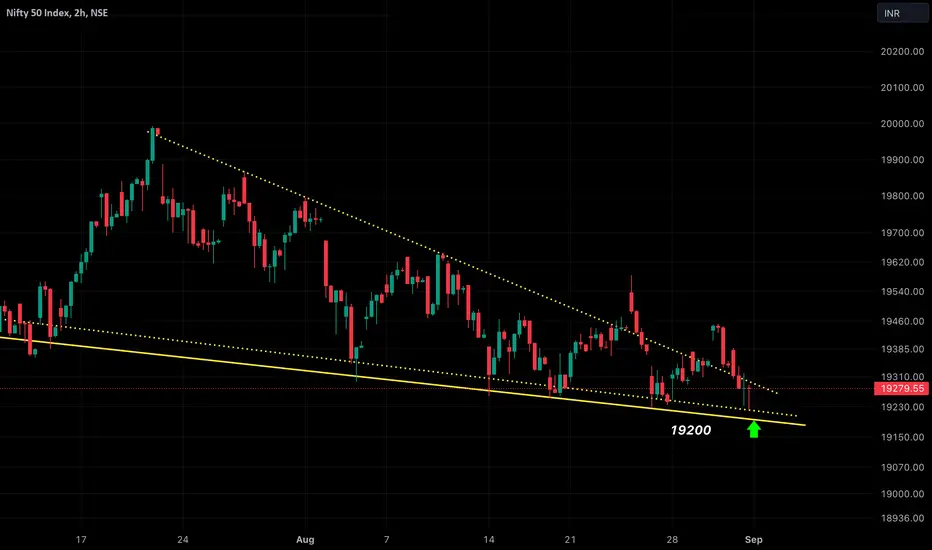
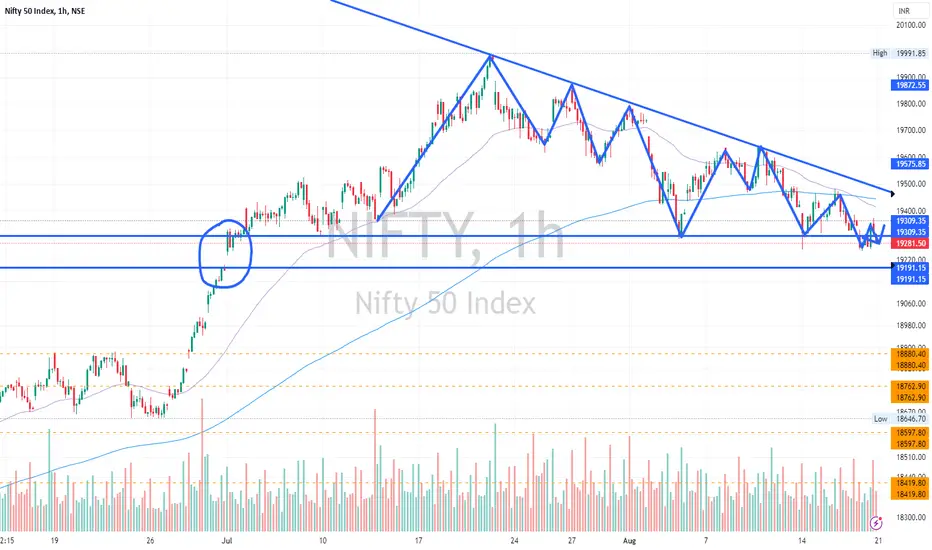
NIFTY still BULLISH unless it breaches 19200 levelsAs we can see NIFTY has shown unidirectional fall despite the break of trend but as we had been analysing since last few days that until and unless NIFTY closes below the trendline we can expect every dip as a buying opportunity hence tomorrow if NIFTY opens weak or flat we may see a strong recovery in the first half so plan your trades accordingly
Wedge
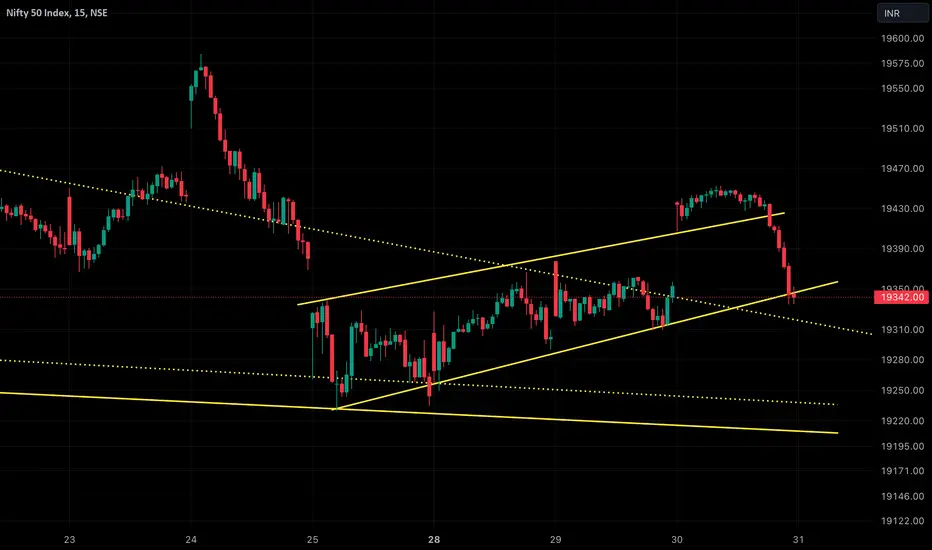
NIFTY couldn’t sustain itself in higher levels, a possible trap?As we have analysed in our previous analysis that NIFTY could possibly show a strong upmove if breaks the given pattern but it opened with huge gap and which finally led to filling of gap with strong selling in the second half. Now as long as NIFTY doesn’t breaks below the following pattern every dip is a buying opportunity so plan your trades accordingly
Can NIFTY break out of this falling wedge pattern this time..?As we can see NIFTY had been sideways throughout the day despite opening strong and went back inside the pattern and remained sideways. Now we can expect NIFTY to finally break off from this pattern for a big move positionally which could be till a new high for NIFTY so plan your trades accordingly everyone
nifty might break downward reasons read descriptionhi guys,
that is rising wedge where chances of breaking down are high and resistance is exactly neck line of an head and shoulder and adx shows trend strength is weak,so in my opinion this is just a pull back , i think it will break down lets see what happens
disclaimer- this is not any investment call or idea , this just my view and it can go wrong ,this is only for educational purposes trade at your own risk :)
NIFTY in falling wedge pattern, ready to REVERSE..?As we can see NIFTY showed a strong reversal from the trendline as we analysed in the last post and showed over 100++ points of recovery but failed to continue its up move as it got rejected from the above trendline, Hence we can expect NIFTY to show a strong movement from here as if it breaks and sustains itself then we can see NIFTY making new high else nifty can remain sideways to negative for coming trading sessions trapping showing weakness so plan your trades accordingly
28 Aug ’23 Post Mortem on Nifty - critical juncture 19310Nifty Analysis
Contrary to the expectations, today turned out to be a boring day. The open was right at the SR level of 19310, still it was gap up as our prior close was near 19250 levels. Even then the resistance breach did not come then, we had to wait till 11.15 for a 5mts candle above the SR zone.
BankNifty was looking in tremendous form today, we will discuss that separately in the analysis below. Due to this Nifty was also staying afloat, the real breach of resistance came at 12.30 only.
23 Aug ’23 Post Mortem on Nifty - India Lands on Moon 🌒🌓🌕Nifty also closed in the green today but did not have as much momentum as BankNifty today. The first divergence happened in the opening 1 hr where Nifty gave up 0.43% ~ 83pts even after having a gap-up opening. The real reasons for a gap-up opening was not clear as the Global hand-out was not that positive.
Traders including me were looking for breakdown possibilities as the 5mts candles at 09.15, 09.25 and 09.50 had so much force. Since Banknifty started reversing the trend and was showing a br
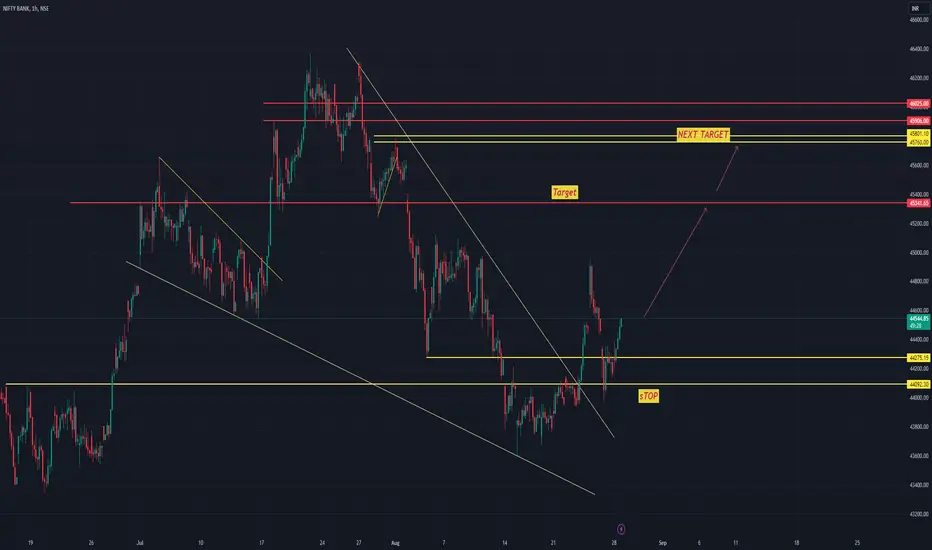
23 Aug ’23 Post Mortem on BankNifty | BN becomes a 🚀🚀🚀We will start with BankNifty today, because we had a reversal pattern today. According to me trend changes are first spotted on BankNifty and hence it works as a leading indicator.
This is what I said in yesterday’s report: Also note that the falling wedge will converge tomorrow, so a strong up move is more dangerous. The bulls will use that opportunity to drive the prices up and it could even take out the 44800 levels in one go.I am not quite sure which of these scenarios will work for tomorr
Godrej Industries Looks Good!Godrej Industries
1. upper band channel breakout at bottom channel
2. convergence in price and psi
3. looks good for uptrend
Conclusion:
The price is in bullish Trend.
Note for everyone who came across this reference:
This chart analysis is only for reference purpose.
This is not buying or selling recommendations.
I am not SEBI registered.
Please consult your financial advisor before taking any trade.
YAYLA GIDA USD PAIRIt would definitely be the first stock I would look at in a possible retracement in BIST100.
The movement is accelerated by the upward break of the falling wedge. There is no resistance in the TRY pair because it is hovering around the ATH levels, but it seems more correct to look at the USD pair.
The lines marked with green on the chart are targets.
Targets were set based on falling wedge, resistance and Fibonacci levels.
Good luck everybody!
Without forgetting; Don't forget the stop-loss!
HIGH/USDT: Unleashing Bullish Potential in Falling Wedge Pattern💎 Hey Paradisers, take a look at the HIGH/USDT daily chart. It's forming a falling wedge pattern, which usually indicates a bullish trend. Currently, it's around the 1.101 demand zone. If it holds steady here and breaks above the upper trendline of the wedge, we might see a bullish trend ahead.
💎 What are we aiming for? We're keeping an eye on potential rises to resistance levels at 1.574. If the momentum keeps up, it could even reach 2.326 and 2.796. If you prefer cautious steps, you might con
HLong
BOTTOM TRIANGLE - PRECOT DAILY CHART ANALYSISPRECOT DAILY CHART ANALYSIS - Showing signs of reversal as it has broken upward after a period of uncertainty or consolidation.
Target: Rs. 198
Self explanatory daily chart analysis for educational purpose
Technicals - Bottom Triangle Pattern / Bottom Wedge
This is just a view by an analyst, please invest at your own risk.
Follow me for more!
XRP/USDT: Cracking the Rising Wedge - Stay Alert!💎 Paradisers, zoom in on XRP/USDT on the 1-hour chart. It's sketching out a rising wedge pattern. At the moment, it's hovering near the demand zone and the supportive trendline, potentially ensnaring some traders.
💎 Historically, it's bounce back from supportive trendline about five times. This could hint at a robust foundation for XRP, making it a contender for long-term considerations. If XRP/USDT manages to take support, we're eyeing ascents to resistance points at 0.5648 and possibly 0.6177
Bullish reversal patternACCELYA daily price trend shows signs of a potential reversal after a period of consolidation. This often involves a bottoming process and a subsequent upward breakout.
Market conditions can change, and various external factors can influence price behavior. Always use technical analysis in combination with other forms of analysis and risk management strategies to make informed trading decisions.
ENGINERSIN : Breakout Candidate#ENGINERSIN #breakoutcandidate #breakoutstocks #trendlinebreakout #momentumstock
ENGINERSIN : Swing Trade / Short term (1-3 months)
>> Beautiful Structure, possibly trendline breakout soon
>> Stock has taken a good pause after the initial momentum and now ready for more upside
>> Good strength and Volumes in stock
SWing Traders should focus on 10% profit & keep trailling
Please Like or comment if u r Liking the analysis & Learning from it. Keep showing ur Love
Disclaimer : This is not a Tr
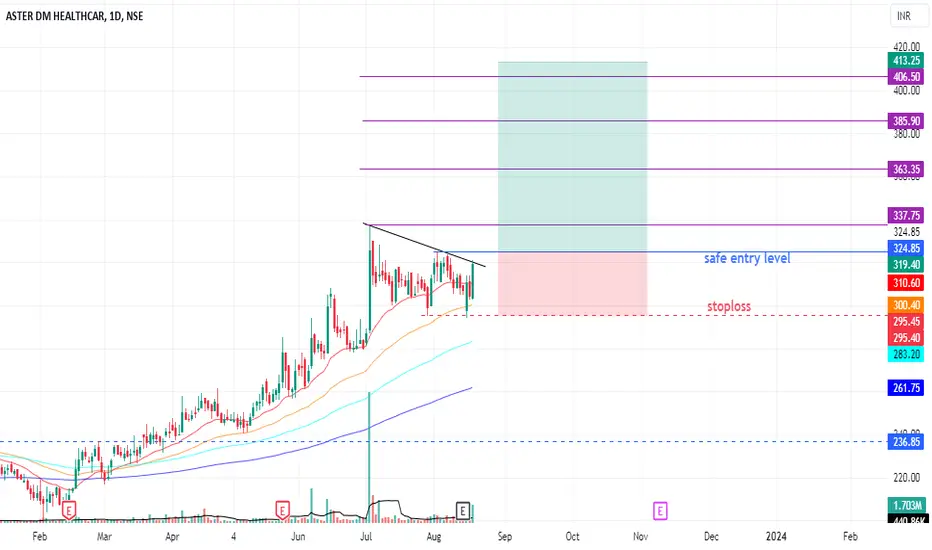
ASTERDM : Breakout Candidate#asterdm #pharmastock #breakout #breakoutcandidate #trendingstock #momentumstock
>> Beautiful Structure, possible Consoldation breakout
>> Good Strength and volume
Swing Traders should focus on 10% profit & keep trailling
Please Like or comment if u r Liking the analysis & Learning from it. Keep showing ur Love
Disclaimer : This is not a Trade Recommendations & Charts/ stocks Mentioned are for Learning/Educational Purpose. Do your Own Analysis before Taking positions.
FINPIPE : Potential Breakout Candidate#swingtrading #finpipe #consolidationbreakout #breakout #flagandpolebreakout
>> Beautiful Structure Range Breakout >> Impulsive Move >> Consolidation >> Pennant formation
>> Perfect Breakout Candidate
>> Good Risk Reward Ratio (min 1:2 RR or possibly more if u hold longer)
>> Good Strength & Volume in stock
Swing Traders should focus on 10% profit & keep trailling
Please Like or comment if u r Liking the analysis & Learning from it. Keep showing ur Love
Disclaimer : This is not a Trade Reco
18 Aug ’23 Post Mortem on Nifty - 19309 support breached 🐻🐻🐻There was only 1 goal for the bears today, to close the markets below 19309. Somehow they got it done today which means we are in for a bear ride next week. Let me try to explain.
We opened right at the 19309 level and then fell to 19258 levels by 10.45 in a show of strength by the bears. From there there was a reversal till 12.00 where we re-touched the 19309 SR zone.
Leg 2 of fall was from 12.00 to 13.40 where we managed to re-test the 19258 levels. I was monitoring very closely to see if we