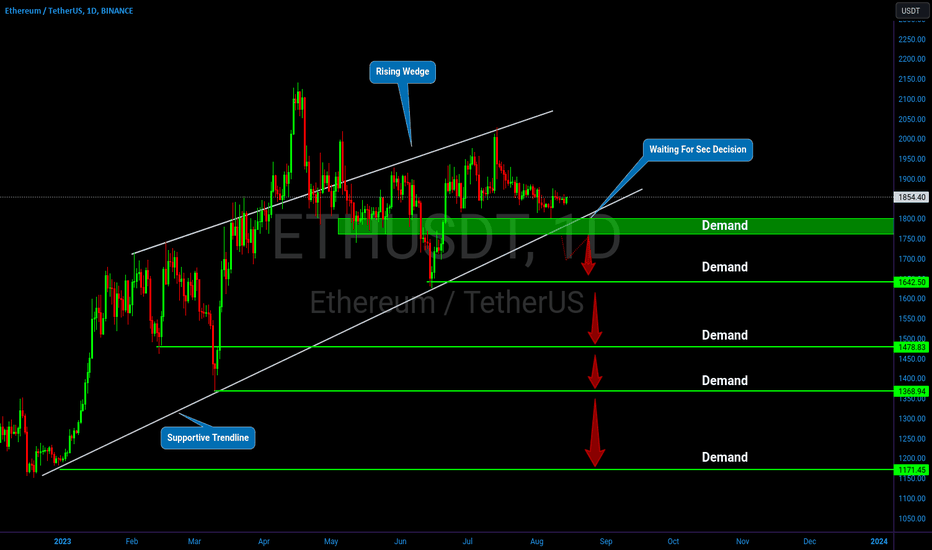
ETH/USDT: Navigating Consolidation and SEC's BTC ETF Verdict 📈💎 Paradisers, let's dive into ETH/USDT. The asset is forming a rising wedge pattern, and currently, it's in a consolidation phase while we await the SEC's decision on the spot BTC ETF. If the SEC leans towards disapproval and the price falls below the 1757 threshold – which serves as both the lower boundary of the rising wedge and a significant demand zone – we might witness a decline towards 1642, and potentially even 1478.
💎 In case panic selling takes over the ETH market, there could be further drops ahead, potentially reaching as low as 1368 and 1171. However, if the SEC approves the spot BTC ETF, it could be a good idea to focus our bullish efforts on BTC rather than ETH. Stay attentive and make well-informed decisions, ParadiseSquad! 🚀
Wedge
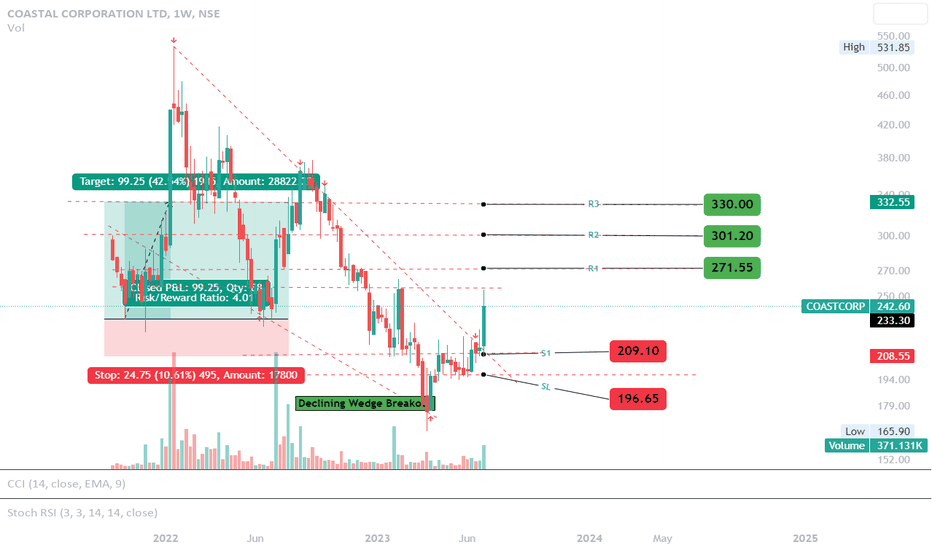
IBULHSGFIN Falling Wedge breakout in Monthly Time FrameIBULHSGFIN Falling Wedge breakout in Monthly Time Frame. Short term breakout happen. watch and Enter.
ILong
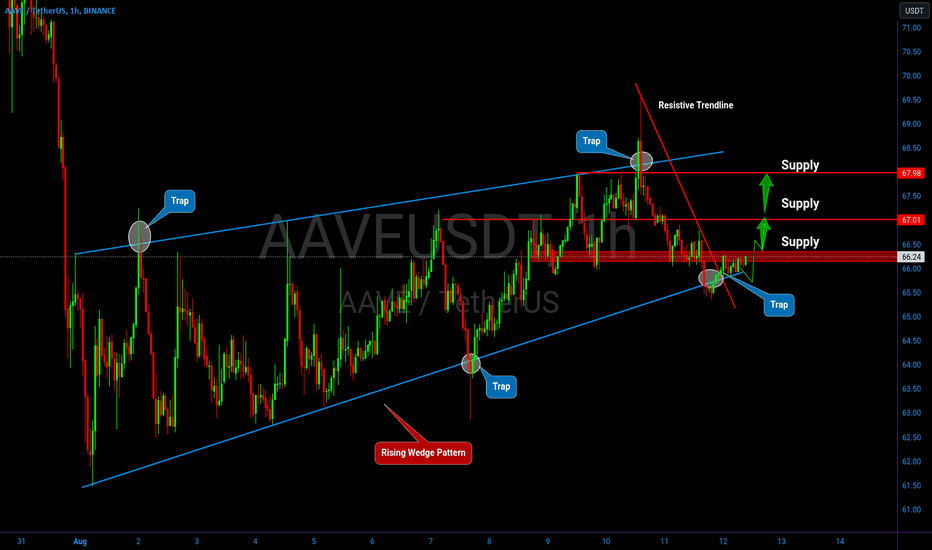
AAVE/USDT Price Alert: Traders Beware of Upcoming Bullish Surge!💎 Paradisers, let's take a closer look at AAVE/USDT. Historically, it's demonstrated three traps within a rising wedge pattern, leading to significant moves. Currently, after breaking its lower trendline, it's making a comeback upwards. This could potentially ensnare traders who went short after the lower trendline breakdown of rising wedge pattern.
💎 Moreover, AAVE/USDT has surpassed its resistive trendline, hinting at bullish momentum. If it manages to climb above the supply level at 66.38, we might witness a bullish surge. This is because short traders' stop-losses would likely be triggered here, propelling the price further. Our eyes are set on potential ascents to supply levels at 67.01 and 67.98. Stay sharp and informed, ParadiseSquad!
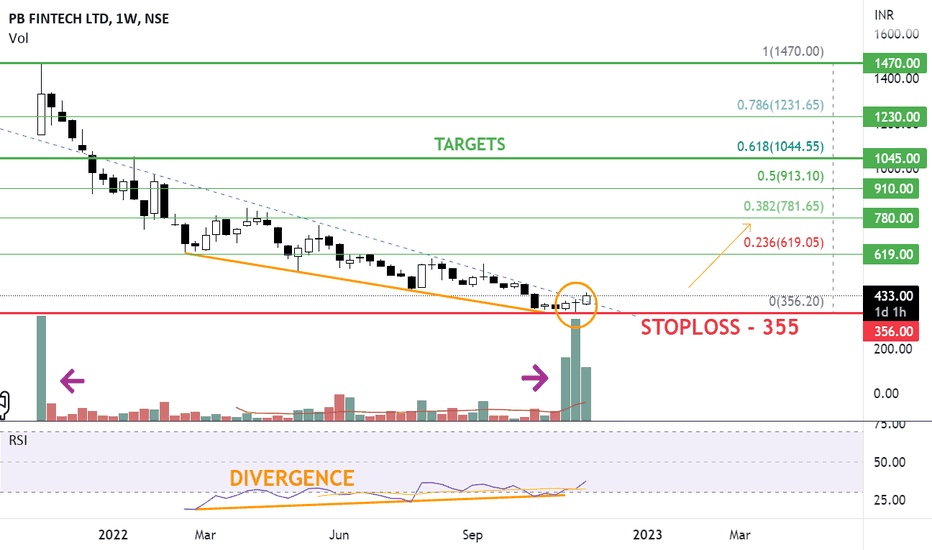
POLICY BAZAAR - #Longterm This is a purely Technical Call.
Low Risk High Reward
Insurance space in India is very premature. With the current gen understanding the importance of Insurance and financial assets, there would be a surge in this sector going forward and not to forget this gen is tech savvy.
PB Fintech Ltd, is a multinational financial technology company, popularly known as Policy Bazar is India’s largest online platform for insurance and lending products through its flagship brands - Policybazaar and Paisabazaar platform through which they provide convenient access to insurance, credit and other financial products.
Policy Bazaar – Launched in 2008 , is India’s largest digital insurance marketplace with a 93.4% market share based on the number of policies sold. Furthermore, in FY20, 65.3% of all digital insurance sales in India by volume was transacted through Policybazaar.
51 Insurer Partners have offered over 340 term, health, motor, home, and travel insurance products on Policybazaar’s platform. As of March 31, 2021, over 48 million Consumers have registered on Policybazaar’s platform and purchased over 19 Mn policies from its Insurer Partners. In Fiscal 21, the annual number of visits on the Policybazaar’s website was 126.5 Mn
Paisa Bazaar – Launched in 2014 , has built 54 partnerships with large banks, NBFCs, and fintech lenders who offer a wide range of product offerings on the platform across personal credit categories, including personal loans, business loans, credit cards, home loans, and loans against property. It is India’s largest digital consumer credit marketplace with a 51.4% market share, based on disbursals in fiscal 2020. Approximately 21.5 Mn unique Consumers have accessed their credit score from Paisa Bazaar. During FY21, Paisa Bazaar enabled disbursals of Rs. 2916 Crs
With the use of Artificial Intelligence, Machine Learning, and Deep Data science. the company has developed capabilities in marketing, product discovery, KYC, risk assessment, claim to process, facilitating the delivery of suitable products which enabled the company to gain a high Market share. The company also helps financial services industry insurers and lending partners create and design customized products for consumers by utilizing broad data insights and data analytics skills
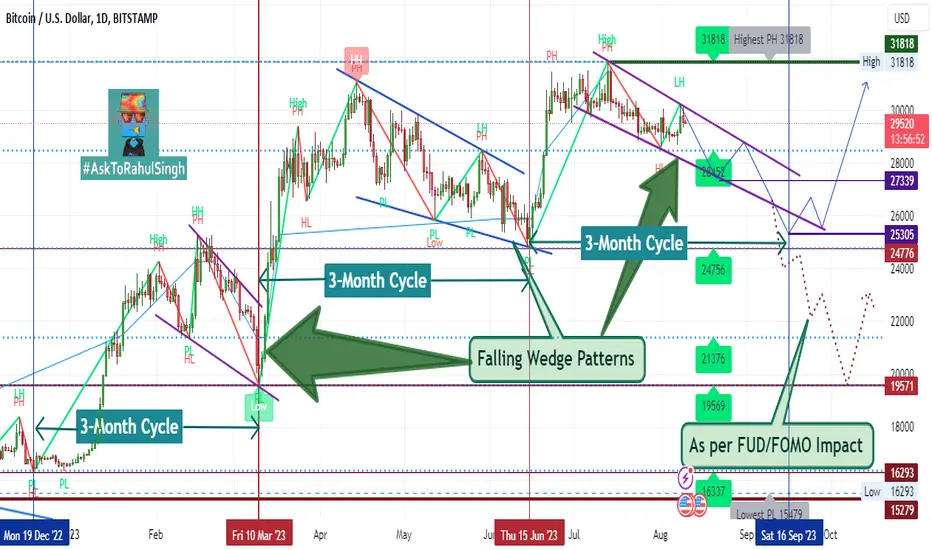
BITCOIN soon under Bearish ZoneBITCOIN 1-day Chart on #BitStamp
This chart pattern show out the movements of 3-month cycle as per daily analysis from dec-2022 to Nov. 2023 of 1-year market trends. Into every 3-month cycle, CRYPTOCAP:BTC downtrend divergence by Falling Wedge Pattern.
Market need a big correction, ad first Lower-Low divergence will be FWB:27K - FWB:25K , and if market goes into hard FUD/FOMO impact, then its Last Lower-Low cut-off point is around here.... $21.5k to $19.5k.
Always #DYOR, Trade with #StopLoss, It's #NFA
&
Must LIKE, SHARE % Comments
Nifty daily analysis for 08/08/23.Nifty has formed a doji and trade whole day in a range of 100 points.
The market is following a rising wedge channel and today has given closing above 20 ema.
On the hourly chart, it has closed above both the moving averages.
There seems no opportunity for option buyer. Market opened gap up and remained volatile.
Fight between buyer and seller couldn't take market anywhere and it closed only 80 points higher.
On 15 minute chart, nifty took support from 20 ema and in the second half after crossing 200 ema took support from the level. Both the moving averages are close enough.
Support :- 19535, 19420
Resistance :- 19600, 19720
Nifty struggled to cross 19600 levels today and closed below it. The market is giving gap up opening and not giving much opportunity to option buyer on intraday basis.
Wait for the price action near the levels before entering the market.
Nifty Falling Wedge Correction : Swing Analysis NSE:NIFTY
Nifty is Trading very choppy for the last few days as it's in a trend correction mode.
it is forming a falling wedge pattern.
Today it can touch the lower range of the wedge and bounce from there.
the breakout level will be above the swing high of 19800, and then 19690 will become a new swing if it plays according to the level marked on the charts.
Comment your analysis on Nifty.
Keep Learning,
Happy trading.
CAMS Stock: Still in Correction, Wait for Wave 5 to CompleteNSE:CAMS is currently in a correction phase, according to the Elliott Wave Theory. The stock has completed wave 3 of the correction, and wave 5 is yet to complete. This means that the stock is likely to continue to decline until it reaches the Fibonacci level of 0.618, which is around ₹1,863 per share. Once the stock reaches this level, it is expected to start a new uptrend.
The Elliott Wave Theory is a technical analysis tool that uses wave patterns to predict future price movements. The theory states that stock prices move in five waves, with three waves up and two waves down. The waves are labeled as A, B, C, and so on.
In the case of CAMS, the stock has completed wave 3 of the current correction, which is a downtrend. Wave 5 is yet to complete, and it is expected to be a downtrend as well. The Fibonacci level of 0.618 is a common support level, and it is likely that the stock will reach this level before it starts to rally again.
Therefore, investors who are interested in buying CAMS stock should wait until it reaches the Fibonacci level of 0.618 before they buy. This will help to ensure that they are buying the stock at a good price.
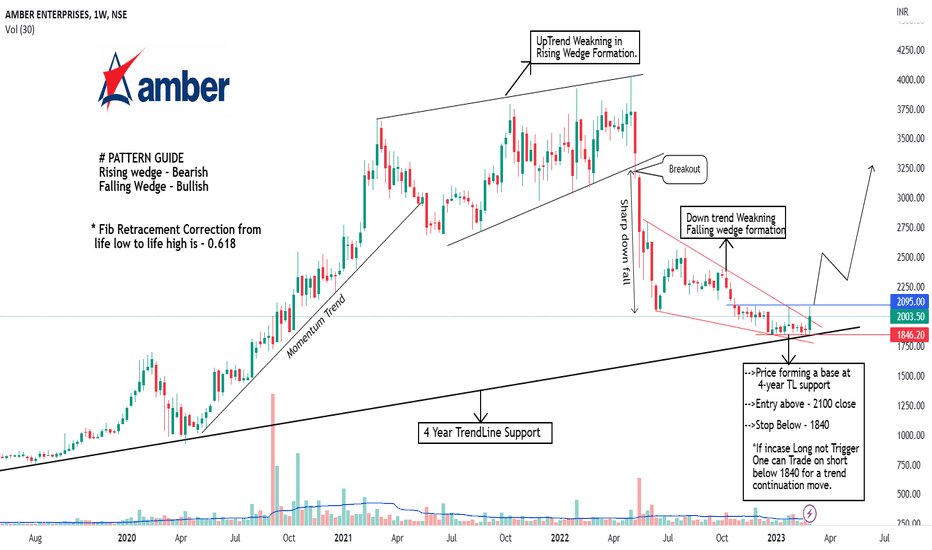
Amber Enterprises: Positional Play Complete AnalysisNSE:AMBER
A complete analysis of Amber is explained on the chart.
Entry should be above - 2100 closing on daily Candle.
Stoploss - will be below Box low 1840.
Target are :- 2550/2780+
It shows multiple signals can start an Up-trend are:
1. Price at 4-year long support Trend line (Trend is intact from its life low)
2. Fib Retracement at 0.618 Significant ratio. (Measured up trend from life low to life high)
3. Falling wedge pattern is formed at support and its breakout is also done with good momentum.
4. There is a Rectangle Box Base is Forming. ( The price should break above its horizontal resistance of 2095)
this is only for educational purposes only.
Always trade with stop-loss.
I hope you found this idea helpful.
Please like and comment.
Share with Your Friends.
Keep Learning,
Happy Trading!
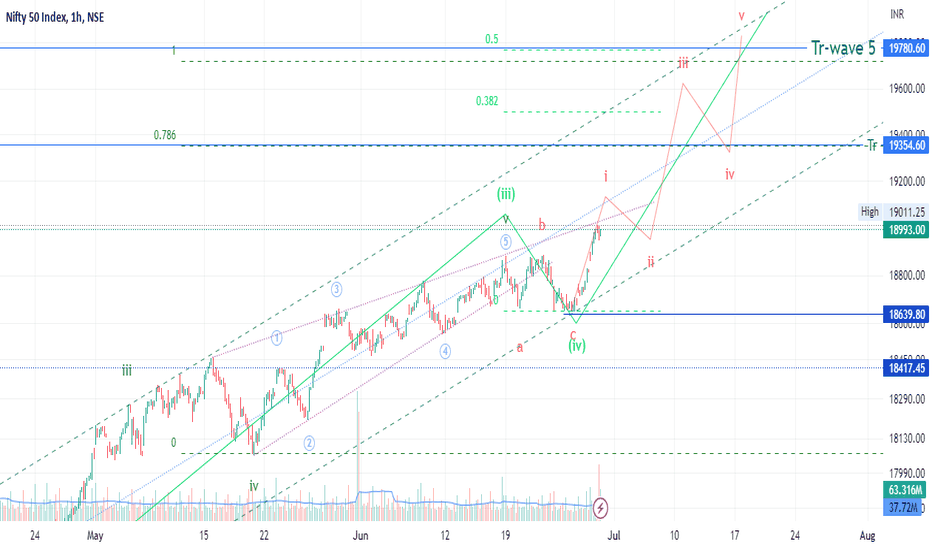
Nifty - near ATH, what's next?NSE:NIFTY reached near its All Time High 19000, peoples are talking about big fall but here the view seems different to me, As per my Elliott wave study and my counting on it which can differ with every EWT user above is my shared view, please look carefully & have a happy trading
here are some points to take in consideration.
1] Price is still in channel. also there is reverse breakout from wedge.
2] Wave 4 correction was not clear until the breakout happened.
3] VIX is near 11. So, volatility would still be low with following its trend.
4] RSI - Daily, weekly, monthly is still bullish no sign of weakness.
5] Daily candle high near upper bollinger band.
6] Daily, Weekly supertrend in green indicating more bullishness
7] no weakness in banking stocks which has highest weightage in nifty.
CDSL: Falling Wedge BreakoutFalling Wedge Breakout:
CDSL has fallen almost 34% since December 2021. It has given breakout from a falling wedge pattern on monthly charts. Rising prices are supportive of breakout in momentum indicators and volume supported price action.
CMP: 1110
R1: 1241 +11.45%
R2: 1457 +31.4%
Stoploss: 986.35
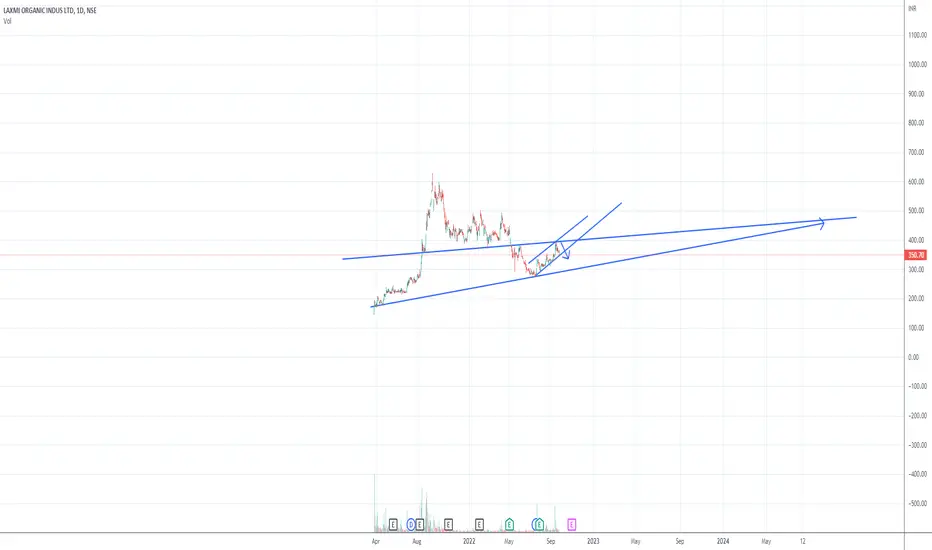
Good company ,Not a good time to add. Wait for SEP QUATER RESULTOk this analysis is my 4rth about LXCHEM from which i made a good return after its IPO DEBUT
Had got huge quantity at around 220 INR AND SOLD AT 500 ABOVE .
Now as I wanted to reenter the stock , so here's my analysis
1.As the company has been shut for close to a month during sep quarter , the results will get affected .
2.Last quarter results are also not par with June 2021 results and eps are down
3.Will make entry only after results are out and when price come down a bit.
4.The company has given notice about Aquitation , it may be a good news it may not be but cant risk as retail people get trapped in news .
Now for the technical part
1. The price has created a Rising wedge pattern , certain sell will come with even a good bottom breakout.
2. The stock can be added Buy on DIPS after this correction
3. 280-300 is the price range to start adding , with adding more on any DIP .
Rising wedge pattern reversal in SIEMENS INDIA LTDSIEMENS INDIA LTD
Key highlights: 💡⚡
📈On 1Day Time Frame Stock Showing Reversal of Rising wedge Pattern .
📈 It can give movement upto the Reversal Final target of above 3882+.
📈There have chances of breakout of Resistance level too.
📈 After breakout of Resistance level this stock can gives strong upside rally upto above 4420+.
📈 Can Go short in this stock by placing a stop loss below 720-.