Wedge
LITECOIN - Falling Wedge PatternNYSE:LTC 1-hr. Chart Analysis
Litecoin moving under #FallingWedge Pattern from last 10 days, and it was created new #ATH of 2023 on 1st July 2023 at $115 and after that continously falling from previous All Time High Mark 10 days ago.
Under this Falling Wedge pattern and #FIBretracement markup points, mostly chances to reach out again $88 to $85 within coming 3-5 days, if market is not suddenly Pumping out before that.
Always #DYOR and Trade wisely by using #StopLoss, It's #NFA
Must LIKE & SHARE it..
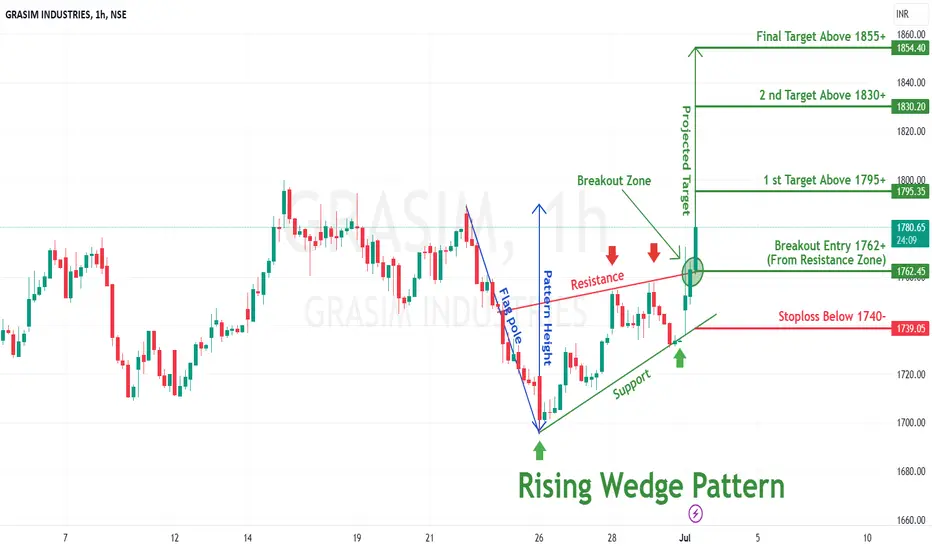
Rising Wedge Pattern Breakout in GRASIM INDUGRASIM INDUSTRIES
Key highlights: ๐กโก
โ
On 1Hour Time Frame Stock Showing Breakout of Rising wedge Pattern .
โ
Strong Bullish Candlestick Form on this timeframe.
โ
It can give movement up to the Breakout target of 1855+.
โ
Can Go Long in this stock by placing a stop loss below 1740-.
RATEGAIN - 15% Arbitrage PossibilityRategain stock has broken its earlier resistance of strong 418.6 levels. With a good strong move past it, and currently retesting its breakout. It shows a potential to test its earlier levels of 502 again.
The trade is forming like, a Buy around 438, an SL at 413 & Exit at 502, its staking 6% of stock for 15% of gain. Forming a risk reward of 1:2.5.
Have your own research & Cheers!
Rising Wedge Pattern Breakout in ULTRATECHCEMENTULTRATECH CEMENT
Key highlights: ๐กโก
โ
On 1 Week Time Frame Stock Showing Breakout of Rising wedge Pattern .
โ
Strong Bullish Candlestick Form on this timeframe.
โ
It can give movement up to the Breakout target of 9660+.
โ
Can Go Long in this stock by placing a stop loss below 7350-.
CDSL: Falling Wedge Breakout Falling Wedge Breakout:
CDSL has fallen almost 34% since December 2021. It has given breakout from a falling wedge pattern on monthly charts. Rising prices are supportive of breakout in momentum indicators and volume supported price action.
CMP: 1110
R1: 1241 +11.45%
R2: 1457 +31.4%
Stoploss: 986.35
Falling wedge breakout and retested level with bullish candleThe extended downtrend in stock since April'22, after a year price given a falling wedge breakout and retested that with bullish candle .
Key support at ema 200 and price above all important moving average.
Entry at current level or above Rs 300 (day's closing candle) ;
Stop Loss below 270 ; Target = t1 & 2
Thanks
-AJ
Disclaimer: The information and publications are not meant to be, and do not constitute, financial, investment, trading or any other types of advice or recommendations.
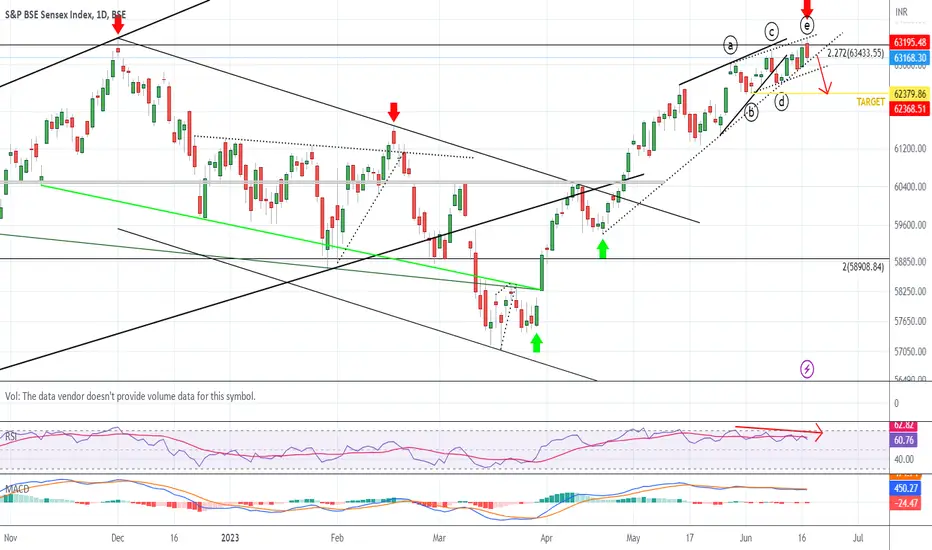
BSE Sensex Ending Diagonal CAUTION!Attached: Sensex Daily Chart as of 19th June 2023
The Ending Diagonal is more evident and clean in BSE Sensex rather than NSE Nifty 50 (although you can observe in Nifty as well), which is why I have chosen to share the Sensex Chart
Observe:
- A well defined trend line with multiple touch points
- Presence of a Bearish RSI Divergence
- Daily MACD already in Sell mode
All that is needed is break of Today's Low and a Close below it (which would also give the Trend Line breakdown simultaneously) and then that would activate the Ending Diagonal/ Rising Wedge Breakdown
The First Downside Target for this pattern would be point b which comes to 62380๐ฏ๐
IGL: Bullish Falling Wedge Pattern IGL has constructed a falling wedge on the 1-day chart in which it has made continuous lower lows and lower highs.
The trend can change from bearish to bullish after the breakout of the resistance trendline. Buyers can expect a bullish move with the following targets: 483 & 504 . IGL Is Bearish below 458 .
Buyers have to break and stay above 504 to increase demand pressure.
Note: Do your own research / discuss it with your advisor
BITCOIN at Rising Wedge in BearishZoneBITCOIN 1-hr. Chart Analysis
As per present Scenario in BTC, its moving perfectly into Rising Wedge Pattern. So, it will be try once again a Uptrend cycle up to $31,950 and reverse back very fast into Downtrend cycle up to next 48 hrs. maximum.
While, as per FIB extension, BTC chart displays every retracement of down cycle towards FWB:27K
Always #DYOR before invest in Crypto
Trader's always use #StopLoss at this situation
Must, LIKE & SHARE
nifty near all time high but ...nifty cmp 18226
yesterday made 18864.70
previous all time high 18887.60
what next ?
technical setup :
rising wedge pattern
stochastic rsi at 100 weekly
highly overbought index
perfect rising wedge pattern in weekly setup with price near trend line resistance .
weekly stochastic rsi at 100 is indicating highly overbought indication too
its good setup to sell with minimum stop loss above trend line close
targets given are bold but as per pattern trade with minimal stop loss & to contra trade against over bullish sentiments , this technical can deliver
happy trading
trade set up :
weekly
sell in zone 18880 to 18920
keeping 19050 as closing basis stop loss
positional
sell in zone 1880 to 18950
keeping 19235 as closing basis stop loss
targets : 18535 / 18305 / 18045 / 17863 / 17553
BANKNIFTY -1H | NEXT EXPIRY VIEW?Hello Traders, Welcome to Oneshot Traders!
BankNifty given good movement as we expected and made good profit in today's expiry trades.
Now, What Next?
As BankNifty still holds the support level 43400, I Have 2 Interpretations in my mind for next movement in banknifty.
1. The pattern looks like a HEAD AND SHOULDER PATTERN. To complete this pattern it should break the 43400 level to complete this Pattern.
2. Forming a FALLING WEDGE PATTERN. Here also the same, the price should move down to the support 43400 level and reverse with a bullish candle in higher timeframe.
My Both setups are shown in the chart.
Now you may understand that this analysis is not just for next immediate move. So, please be stay tuned here and click on follow button . Receive further updates directly to your mail when we update here.
Thank you,
Happy Trading...