nifty near all time high but ...nifty cmp 18226
yesterday made 18864.70
previous all time high 18887.60
what next ?
technical setup :
rising wedge pattern
stochastic rsi at 100 weekly
highly overbought index
perfect rising wedge pattern in weekly setup with price near trend line resistance .
weekly stochastic rsi at 100 is indicating highly overbought indication too
its good setup to sell with minimum stop loss above trend line close
targets given are bold but as per pattern trade with minimal stop l
Wedge
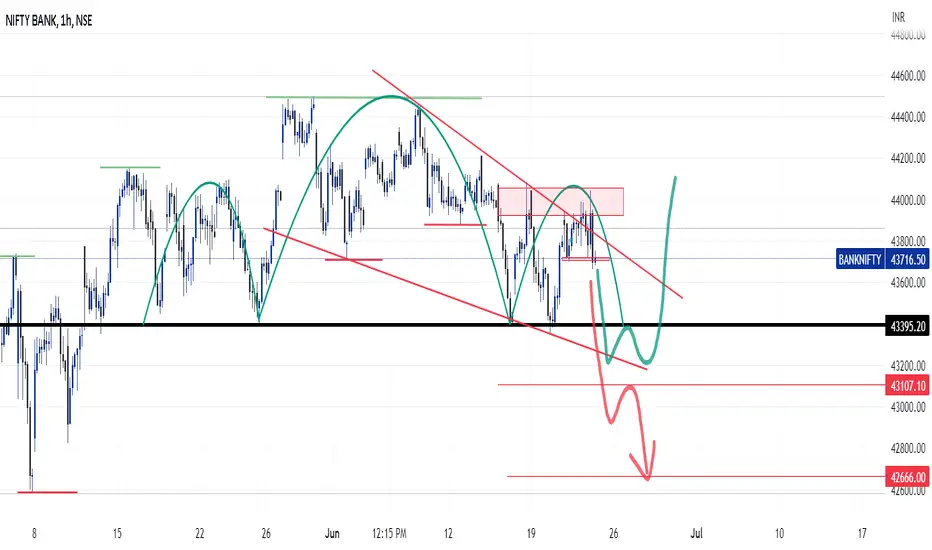
BANKNIFTY -1H | NEXT EXPIRY VIEW?Hello Traders, Welcome to Oneshot Traders!
BankNifty given good movement as we expected and made good profit in today's expiry trades.
Now, What Next?
As BankNifty still holds the support level 43400, I Have 2 Interpretations in my mind for next movement in banknifty.
1. The pattern looks like a HEAD AND SHOULDER PATTERN. To complete this pattern it should break the 43400 level to complete this Pattern.
2. Forming a FALLING WEDGE PATTERN. Here also the same, the price should move down to th
BANKNIFTY -1H | What Next?𝗛𝗲𝗹𝗹𝗼 𝗧𝗿𝗮𝗱𝗲𝗿𝘀, 𝗪𝗲𝗹𝗰𝗼𝗺𝗲 𝘁𝗼 𝗢𝗻𝗲𝘀𝗵𝗼𝘁 𝗧𝗿𝗮𝗱𝗲𝗿𝘀!
BankNifty given good movement to our levels posted yesterday. Made good profit in today's trades.
𝗡𝗼𝘄, 𝗪𝗵𝗮𝘁 𝗡𝗲𝘅𝘁?
As BankNifty moving to our previous supply zone (43912 - 43976).
Here are the both side Important Levels:
RESISTANCE: 43976 | Reversal Zone: 43926-44100
SUPPORT: 43815, 43700, 43500
As per open interest Biggest resistance at 44000 and biggest support at 43500
I'm still stick to my previous 3 Interpretations which I posting from Mond
NIFTY50 - 1H | RISING WEDGE!!!𝗛𝗲𝗹𝗹𝗼 𝗧𝗿𝗮𝗱𝗲𝗿𝘀, 𝗪𝗲𝗹𝗰𝗼𝗺𝗲 𝘁𝗼 𝗢𝗻𝗲𝘀𝗵𝗼𝘁 𝗧𝗿𝗮𝗱𝗲𝗿𝘀!
I'm waiting for this day from long time, I feel it's time NIFTY50 Formed a Rising Wedge Pattern In Higher Time Frames. But, Its not confirmed at.
Here the Important levels which decides nifty50 for coming days.
If Market moves ABOVE 18798 it is still in buying zone and the Target is 18879
If market breaks 18719 and trades below it we can confirm the break down from rising wedge and can go for selling. Targets for selling side are 18672, 18627, 18
APT moves in FALLING Wedge PatternAPT 1-day Chart Analysis
As per daily basis chart Analysis of APTOS is moving into Falling Wedge Pattern, from January after launching of this Token, means continue in Downtrend, but as par falling wedge bullish signals, after July it will be start moving again in Bullish mode, before that it will goes under Bearish Zone in July with Last Lower-Low Cut-off point at $3.8 to $4.2 approx.
Always #DYOR before investing in Crypto.
Trade Wisely with using of #StopLoss always.
also must LIKE, COMMEN
HEMIPROPHEMIPROP:- The stock has formed a falling wedge pattern, which has given a breakout, if the stock sustains above 101.50, we may see a movement to the upside.
Hello traders,
As always, simple and neat charts so everyone can understand and not make it too complicated.
rest details mentioned in the chart.
will be posting more such ideas like this. Until that, like share and follow :)
check my other ideas to get to know about all the successful trades based on price action.
Thanks,
Ajay.
kee
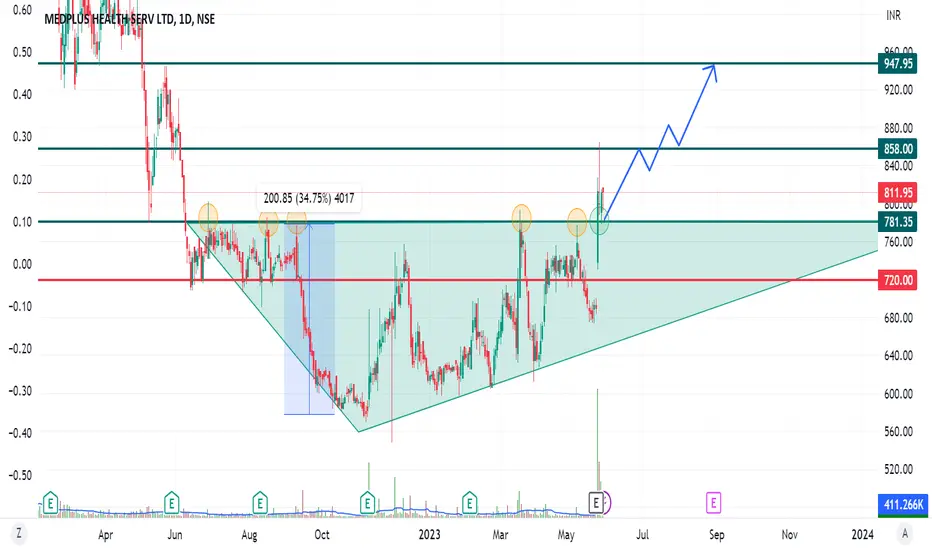
MEDPLUS LOOKS GOOD WITH A BREAKOUT OVER RESISTANCE LINE WITH VOLMEDPLUS has price action has given a Breakout over a long term resistance line at 781.35 on 26-May-23 and this happend the day after the Financial results for FY.
Taking the length of the Wedge (about 200) and the past Resistance/ Support Levels, there is a potencial for
Entry Above 781 for a long trade
StopLoss: below 720
Target 1: 858
Target 2: 948
Note: I am not a professional trader or advisor. This is just to share my study/ analysis. Any actions by you should be based on your independen
GLENMARKGLENMARK:- Stock has given breakout, if you want to plan something then let the price come back to 620 then 621, do it after that, till then keep an eye on the stock
Hello traders,
As always, simple and neat charts so everyone can understand and not make it too complicated.
rest details mentioned in the chart.
will be posting more such ideas like this. Until that, like share and follow :)
check my other ideas to get to know about all the successful trades based on price action.
Thanks,
Ajay.
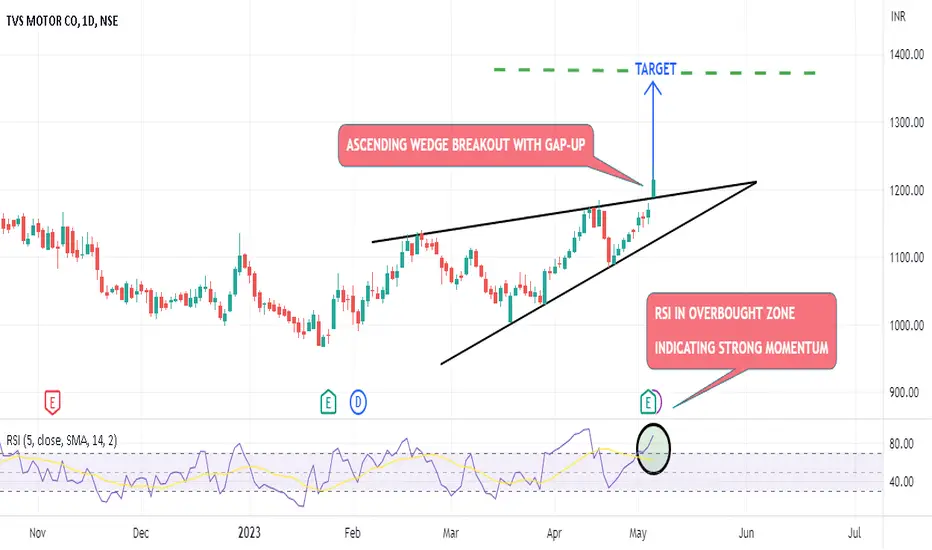
TVS MOTOR ASCENDING WEDGE BREAKOUT TRADE - BUY
TVS Motors have formed an ascending wedge pattern on the daily timeframe with 2 contact points above and 3 contact points below
Yesterday it has broken out of the pattern with gap-up which acts as a very strong confirmation of the success of the trade
Although no volume surge is present but RSI is present in OVERBOUGHT zone indicating that the momentum is very strong for the stock right now which in turn is a boon for the stock which would give the push for the stock to rise
TP is set a
Banknifty -1Hour | Sure shot EntryAs we posted banknifty anylysis yesterday we executed the trade as per our levels which worked perfectly and captured 200 points in todays(08-06-23) market.
This Analysis is continuation to the previous analysis.
As Market closed at 43995, If we apply Fibonacci levels on todays movement 44144 to 44182 is the retracement zone. Where there is a high probability for a reversal from that zone.
If market moves up to 44144, will wait for bearish candle to form near that zone and then we can take a
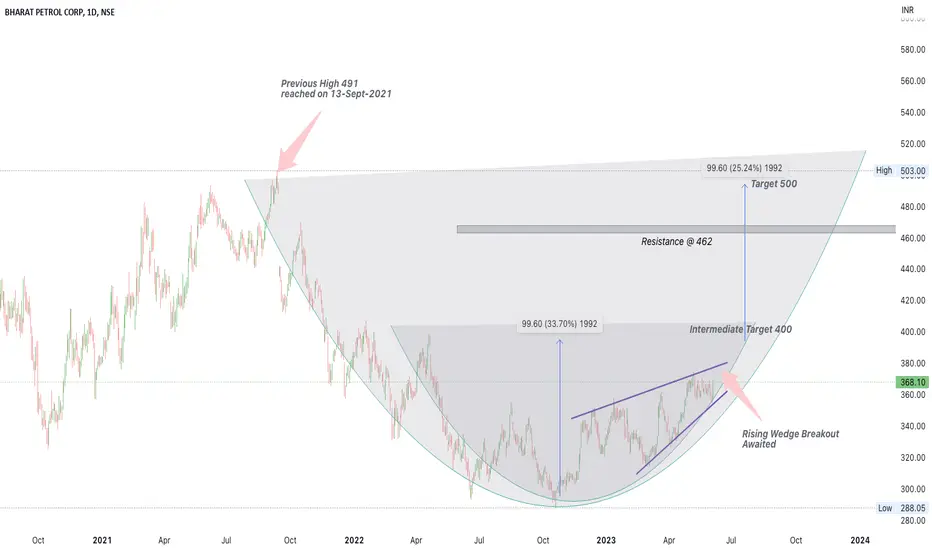
Bharat Petroleum, BullishThe stock has been in sustained downtrend since 2021, forming rounding bottom pattern.
The correction in the stock price after dividend payout got extended further upto 298 levels.
There is also small rounding bottom pattern inside the major one along with rising wedge
pattern which is likely to breakout soon. The levels are shown on the chart, for educational
purpose only and are not any trade recommendation.
Massive Inverted Head & Shoulder Break in Cignittec weekly chartA massive Inverted Head and Shoulder breakout is about to happen any time on closing basis, above 635 for a target of 900. I will mention the Stop loss After completion of the successful breakout.
I will keep you posted.
Please share your thoughts/opinions....very important to me.....
CLong
Bottom Triangle - Bottom WedgeShemaroo
The price has reached a point where it appears to have hit a bottom and is now showing signs of a potential reversal. This is indicated by a pattern known as a Bottom Triangle, which involves two trendlines converging as prices form lower highs and higher lows. During this phase, the trading volume tends to decrease as the price fluctuates within a narrower range, reflecting market uncertainty.
However, before the triangle pattern reaches its apex, there is a significant breakthrough