Chart Analysis: XRP / USDT (Daily Timeframe)Pattern: Demand Zone Rebound (Bullish Recovery Setup)
The chart shows XRP bouncing from a strong demand zone, signaling a potential short-term reversal after recent selling pressure. The price action suggests that buyers are gradually regaining control, with momentum shifting upward toward key resistance levels.
Key Observations
🔹 Demand Zone: Around $2.10 – $2.20, acting as strong accumulation support where buyers previously stepped in.
🔹 Immediate Resistance: Supply zone near $2.90 – $3.00
Wedge
BRITANNIA - Falling Wedge + Bullish Engulfing Combo💹 Britannia Industries Ltd (NSE: BRITANNIA)
Sector: FMCG | CMP: ₹5,892.50 | View: Falling Wedge + Bullish Engulfing Reversal Setup
📊 Price Action:
Britannia is currently displaying a strong confluence setup where both a chart pattern and a candlestick pattern align perfectly to signal a potential trend reversal.
After weeks of consolidation within a downward-sloping structure, the stock has formed a Falling Wedge pattern — a classic bullish reversal formation.
Adding strength to this structure,
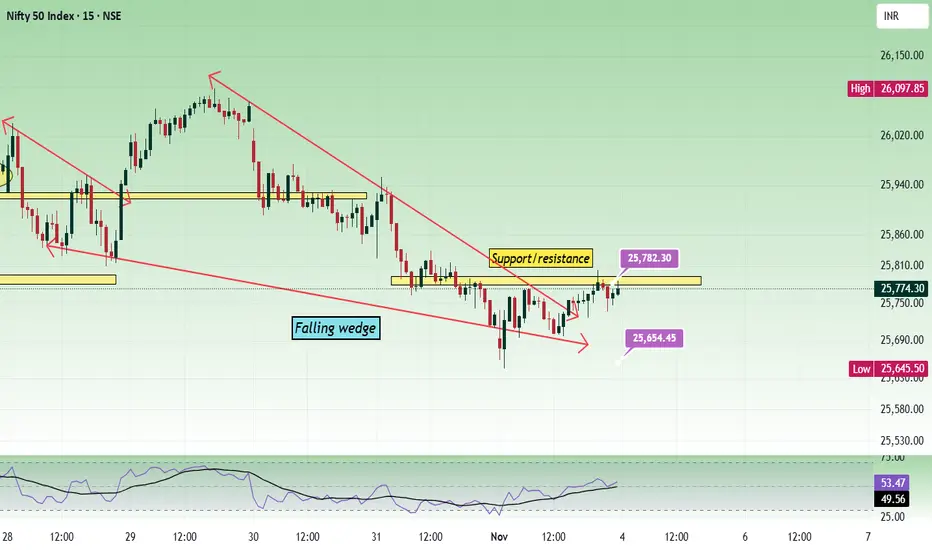
Nifty - Expiry day analysis Nov 4Price moved within the range of 25650 to 25780 today, and these levels are acting as strong support/resistance. Nearby support is at 25500, and resistance is at 25900. And still the price is inside the falling wedge.
Buy above 25820 with the stop loss of 25780 for the targets 25860, 25900, 25940 and 25980.
Sell below 25720 with the stop loss of 25760 for the targets 25680, 25640, 25600 and 25540.
The expected expiry day range is 25600 to 25900.
Always do your analysis before taking any trade.
Hero MotoCorp: Wedge Signals Wave 5 ExhaustionAfter a strong five-wave impulse from ₹3,344 to ₹5,717, Hero MotoCorp appears to have completed a textbook rally, with Wave (5) showing all signs of exhaustion.
The final leg developed into a rising wedge , a common terminal pattern that often precedes short-term pullbacks. Momentum loss is also visible on the RSI , which has been forming lower highs within a descending channel — a classic sign of fading strength.
From an Elliott Wave perspective, the advance from Wave 4 (₹4,195) to Wave 5
Nifty - Weekly Review Nov 3 to Nov 7Nifty in the lower time frame has formed a falling wedge, which is a bullish sign and also price is at the important crucial zone 25700. In the daily time frame, the price is showing bearish strength.
If the price breaks the 25680 - 25720 zone with bearish strength, 25500 can be tested.
Buy above 25740 with the stop loss of 25690 for the targets 25780, 25840, 25900, 25940, 25980, 26040 and 26080.
Sell below 25640 with the stop loss of 25690 for the targets 25600, 25560, 25520, 25460, 25400, 25
PB Fintech attempts recovery after first major correctionTopic Statement:
PB Fintech Ltd (PolicyBazaar) is recovering from its first significant correction following a steady bull run, with price action now approaching key resistance levels.
Key Points:
1. The stock retraced to the 50% Fibonacci level at 1300, where it found strong support and began to stabilize
2. A wedge candlestick pattern is forming, and a breakout in either direction could determine the next trend
3. The price faces stiff resistance at the 2000 mark, which may act as a ceiling u
#Silver | Falling Wedge + Inverse H&S = Bullish Cocktail#XAGUSD | 4H Chart
Head & Shoulders completed its breakdown target ✅
Price found support at the demand zone, formed a falling wedge breakout, and built an Inverse H&S.
Now consolidating right below the neckline, watching Immediate Resistance @48.464 👀
Above this, potential retest of key resistance zone 49.459 – 50.475/50.897 (previous H&S breakdown area).
Bias: Bullish above 48.464; confirmation on 4H close 🔥
#Silver #XAGUSD #HeadnShoulders #FallingWedge #InverseHeadnShoulders #PriceActi
NIFTY 50 – Intraday level 15min TFNIFTY 50 – Gap Resistance Test After Falling Wedge Breakout
Timeframe: 15 min
📌 Key Observations:
Falling wedge pattern formed over the last few sessions, followed by a clean breakout with rising volume.
Price has now rallied toward the gap resistance zone near 24,880–24,900, where supply previously stepped in.
24,750 is acting as immediate support — the level from where the breakout initiated.
Next resistance to watch is 25,138, which aligns with a previous structure zone.
📈 Trading
APL Apollo Tubes: Rising Wedge — The Climb Before the Slip?Price action has been rising within a narrowing wedge pattern — a structure that often signals exhaustion near the top. A breakdown below the lower trendline would confirm weakening momentum.
Disclaimer: This analysis is for educational purposes only and does not constitute investment advice. Please do your own research (DYOR) before making any trading decisions.
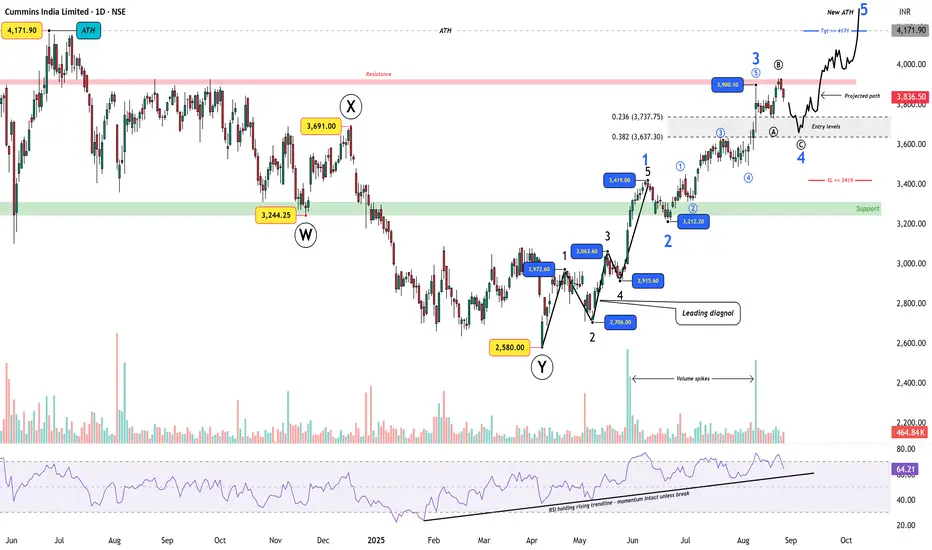
Cummins India – Wave 4 Expanded Flat Before New ATHFrom the 2580 low , Cummins India has likely started a new impulse sequence .
Wave 1 unfolded as a Leading Diagonal , confirmed by messy overlaps and volume spikes.
A sharp Wave 2 retracement was followed by a powerful Wave 3 rally to 3900.
RSI has held a rising trendline throughout, supporting momentum.
Now, price action suggests a Wave 4 Expanded Flat :
Wave A dipped from 3900.
Wave B exceeded the high.
Wave C is projected to retrace into the 3737–3637 Fib zone , offering an
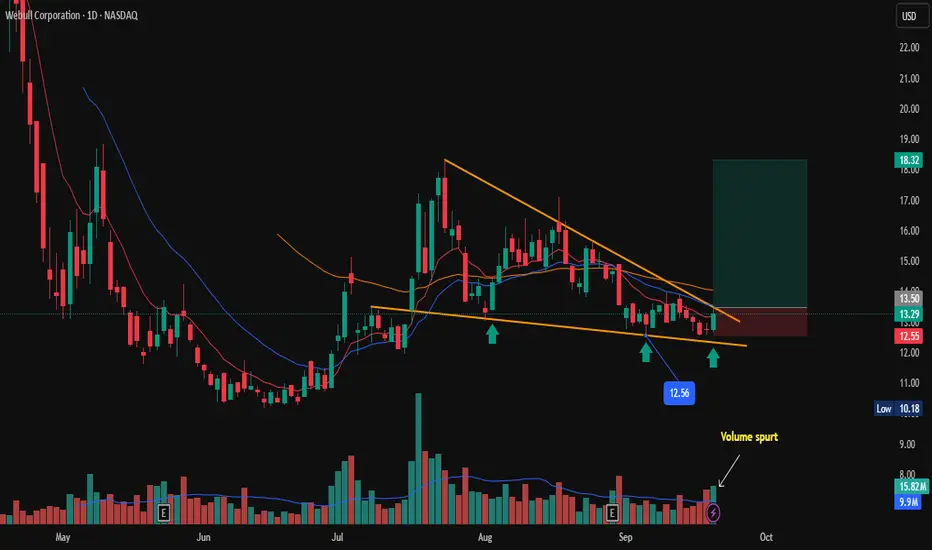
NASDAQ: Webbull Corporation - Long Setup, Reversal SignWebbull Corporation shows signs of a potential long opportunity after forming a Bullish reversal pattern (falling wedge) on the daily chart. Price respecting a trendline, and Volume spurt on last trading session. signaling Bullish momentum. hinting at a possible uptrend initiation.
Key Levels to Watch:
Immediate support at $12.56 (immediate low)
Trade Plan:
Enter long above $13.50 on confirmation of bullish candle close.
Stop loss above $12.60 to limit risk.
Target $18.00 as per
"Broadening Wedge Descending Pattern – Route Mobile" (Bullish)🔹 Technical Setup:
A Broadening Wedge Descending Pattern has emerged on the monthly timeframe, signaling a potential major trend reversal after a prolonged consolidation.
The stock has tested and respected its strongest support zone (₹700–₹750) and is now attempting a breakout, indicating the early stage of a multi-year bullish cycle.
📈 Pattern: Broadening Wedge (Descending)
🧭 Strong Support: ₹700–₹750
🎯 Bullish Target Zone: ₹1,500+ (first breakout confirmation)
📊 Potential Upside: ~90% from
WTI Crude Oil – Dual Falling Wedges in Play!🛢️ #WTICrudeOil
CMP: $58.25
🟡 S maller Falling Wedge (Yellow)
• Breakdown candle formed
• Breakdown confirmation on weekly close below $58.22 (low of breakdown candle)
• Target: $52.71
• Converges with key price action support zone at $52.48–50.55
• Also aligns with long-term wedge trendline support
🟣 Larger Falling Wedge (Purple)
• Still intact
• Bullish Breakout confirmation: Weekly close above $77.57
🔽 Support Levels
• Immediate: $55.15
• Zones: $52.48–50.55,
#MCXCrudeOil Weekly – Breakdown into Major Support Zone#MCXCrudeOil Weekly – Breakdown into Major Support Zone
CMP: 5,246
Crude Oil has broken down from a descending triangle with a confirmed weekly close below 5,308 , triggering target of 4,636 . This move unfolds within a larger falling wedge pattern , adding confluence and signaling potential volatility ahead.
This breakdown aligns with two key confluences :
📉 The falling wedge lower trendline.
🟠 A major historical demand zone at 4,692 – 4,499 , which was previous resistance tu
Axis bankPrice faced resistance at the 1200 - 1220 zone and falling. In higher time, the price is moving inside an ascending triangle. In a lower time frame, a falling wedge has formed. Both are bullish patterns. Holding 1160 is important for bulls.
Buying is risky if the price dont have volume strength.
Buy above 1168 with the stop loss of 1161 for the targets 1174, 1182, 1190, and 1198.
Sell below 1156 with the stop loss of 1164 for the targets 1148, 1140, 1132, and 1126.
Always do your analysis before
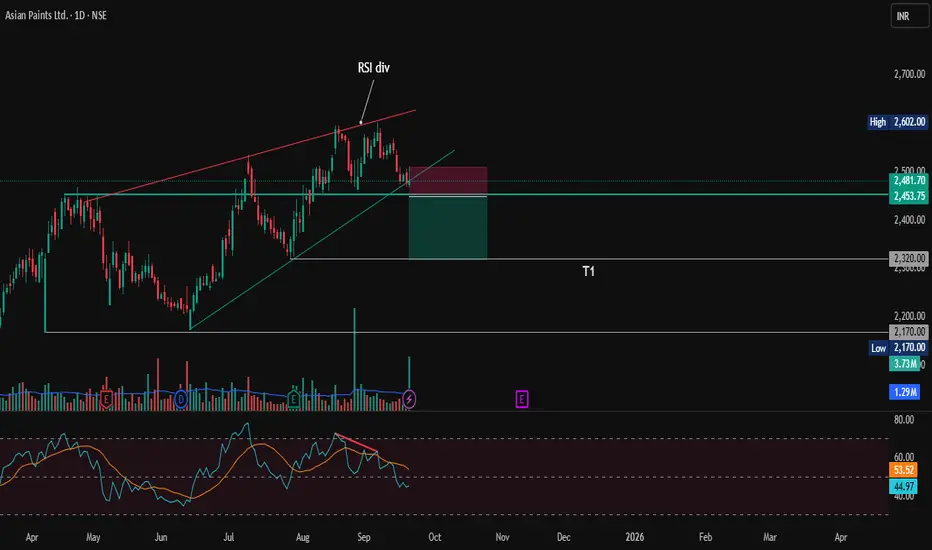
Asian Paints: Short Setup — Bearish Reversal SignalAsian Paints shows signs of a potential short opportunity after forming a bearish reversal pattern (Rising wedge) on the daily chart. The stock failed to sustain above the resistance near 2600, Formed a Double top pattern. The RSI is showing bearish divergence, signaling weakening momentum. hinting at a possible downtrend initiation.
Key Levels to Watch:
Immediate support at 2450 (swing low)
Further downside target around 2320 if support breaks decisively
Trade Plan:
Enter short below 2
Bajaj Health care falling wedge pattern.Price Action: A "weapon candle breakout" is evident, with the price testing 497.60 INR, supported by a "huge volume" spike, indicating strong bullish momentum.
Pattern: A falling wedge pattern is noted, typically bullish, with the breakout suggesting a potential upward trend.
Targets and Support:
As per chart any dip up to 458 is buying opportunity for Price targets are set at 646 INR (TG1) and 784 INR (TG2).
Indicators:
RSI (14, close) at 67.72 nears overbought levels.
MACD shows a bullish
Hindalco – Monthly Chart | Educational View
Near ATH, testing a 20-year trendline — worth studying.
Price is trading inside a long-term rising wedge.
The upper trendline has acted as resistance multiple times (2007, 2011, 2022, and now).
Currently consolidating in a tight range near ATH (~₹775).
Volume needs improvement — a decisive breakout above resistance should ideally come with strong volume confirmation.
⚠️ Risks / Watch-outs:
Rising wedge patterns can also resolve downwards if breakout fails.
Repeated rejections fro
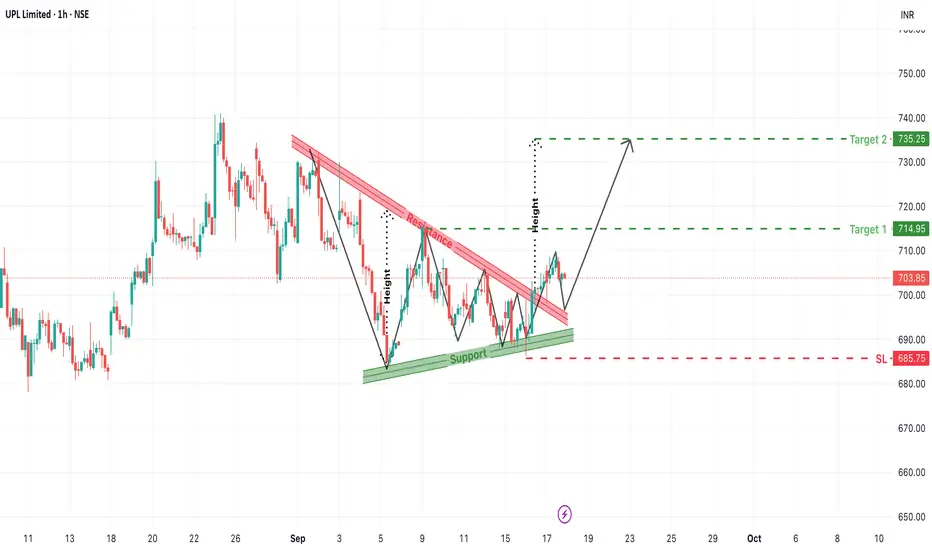
UPL Breakout from Falling Wedge: Bullish Continuation Ahead?The chart for UPL Limited (1-Hour, NSE) presents a promising bullish breakout scenario, emerging from a well-defined falling wedge (descending channel). Traders and investors watching for breakout opportunities will want to monitor this move closely as the price breaks above resistance with potential to test higher levels.
1. Chart Pattern Formation: Falling Wedge with Bullish Implication
Over the past several trading sessions, UPL consolidated inside a downward sloping wedge pattern characte
BANKNIFTY: POSSIBILITY OF RISING WEDGE BREAK DOWN• BN have formed a lower low on higher time timeframe
• There are multiple fundamental good news (GST + Strong global market) hits the market, but the upside is limited
• A clear rising wedge has formed in BN in lower timeframe
• Market is halted near day candle EMA 21.
• Any breakdown of wedge in hour candle could trigger a massive down move.
• T1 : 53500 and T2: 52086
• T1 is tested multiple time hence the support is weak and chance of breakdown of T1 is extremely high.
• Opportunity to short
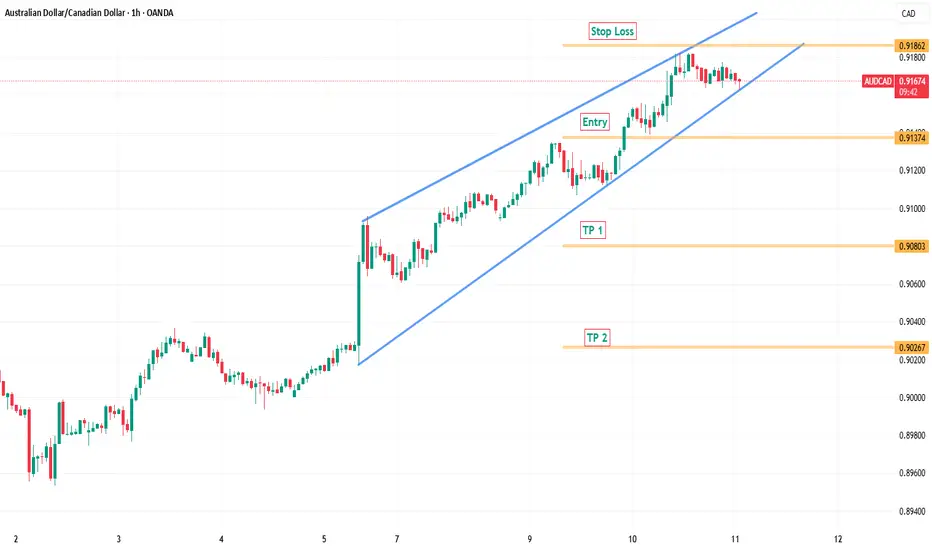
Bearish Signal at BreakoutThe AUDCAD is on strong Buy side since the start of this month. Enough to be in overbought area.
The Channel / Rising wedge is confirming its strong buy on H1 timeframe.
Now we are waiting for the breakout of this Rising Wedge. Yet we will not trade unless it doesn't break its Lower High at 0.9140 which will be the start of our Bearish Trend on H1 time frame. the first target is 0.9080 and 2nd Target is at 0.9026 .
I already placed two trades, 1 aiming for target 1 and 2nd aiming for
HDFC Bank – Rising Megaphone & RSI DivergencePrice structure since 2020 has unfolded inside a broadening rising channel (megaphone type). The latest high at ₹1,018.85 came right at the upper boundary.
Price action: A fresh high was made, but momentum did not confirm.
RSI: Long-term bearish divergence is visible – each new price high comes with weaker RSI peaks. Still, RSI is holding above the 50 zone and its rising trendline.
Implications:
If RSI holds above 50, bulls may attempt another breakout above ₹1,018.85.
If RSI breaks