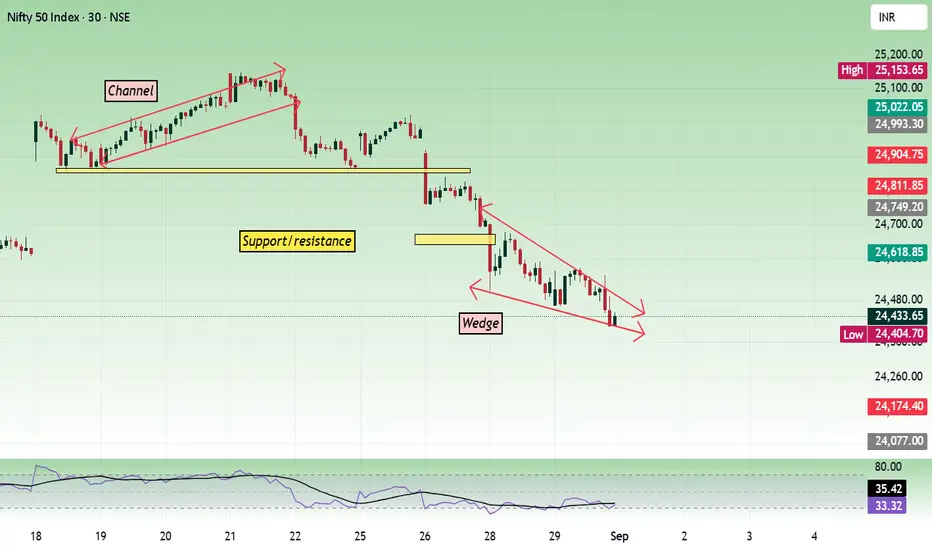
Nifty - Weekly Review Sep 1 to Sep 5Price action has formed a falling wedge pattern in Nifty. The falling wedge pattern is bullish, and sustaining a price above 24500 is crucial. The zone 24400 to 24500 will act as a choppy zone.
Buy above 24520 with the stop loss of 24460 for the targets 24560, 24620, 24680, 24720, and 24760.
Sell below 24380 with the stop loss of 24430 for the targets 24340, 24280, 24220, 24160, 24120, and 24080.
The main trend is bearish, and the minor trend is bullish unless bulls show their strength.
Always d
Wedge
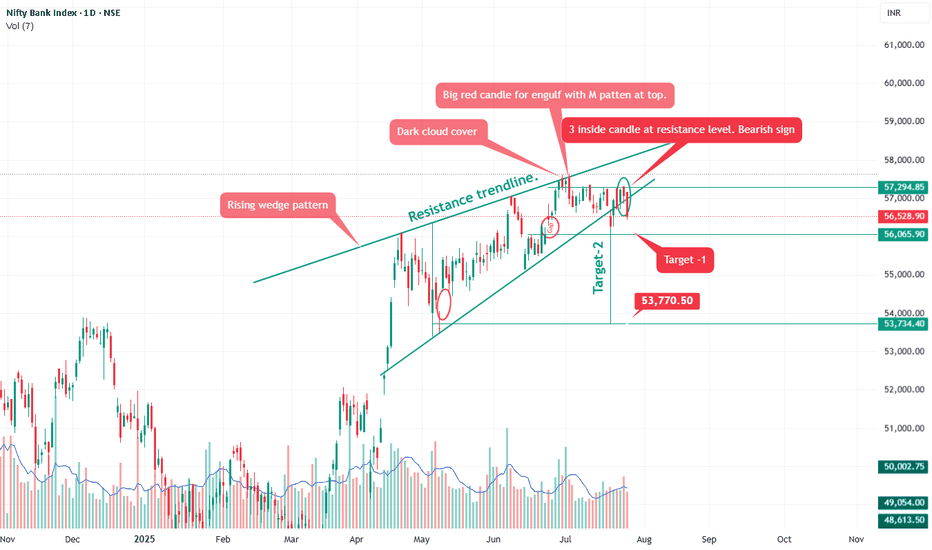
Bank nifty Rising wedge pattern.Pattern Analysis
Rising Wedge Pattern:
A bearish pattern typically seen near tops. It shows narrowing price movement with higher highs but declining momentum.
Breakdown confirmed as price has fallen below the lower wedge support trendline.
Confirms selling pressure and rejection from the top near 57,300โ57,500 zone.
๐ฏ๏ธ Candlestick Signals
Dark Cloud Cover:
A bearish reversal pattern indicating sellers have taken control after a bullish phase.
Big Red Candle + โMโ Pattern:
Bearish engulfing a
LICHSGFINPrice is forming a falling wedge. A falling wedge is a bullish pattern. Since the overall market sentiment is bearish, we will discuss bearish movement.
Price can have a pullback or fall from the current price.
In case of a pullback back if there is any bearish sign at the 554 - 556 zone, sell below 554 with the stop loss of 559 for the targets 549, 544, and 539.
No pullback and down trend continues, then sell below 548 with the stop loss of 553 for the targets 544, 538, and 532.
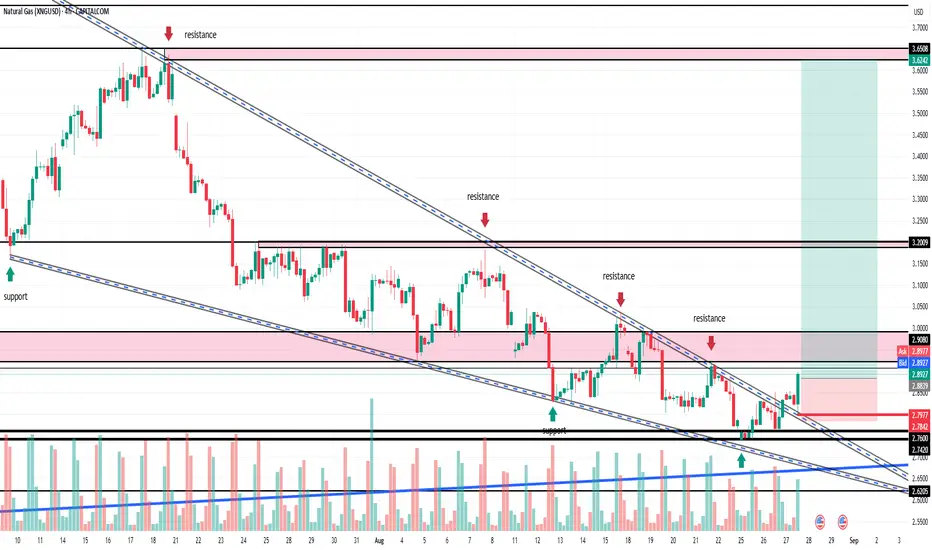
NG : A FALLING WEDGE BREAKOUT WITH 1:7.5 RRโข NG was in downtrend and in a falling wedge for last 2 months
โข Today It successfully retest the upper trend line of the wedge and confirming the BO
โข A trade with 1:7.5 RR
โข SL and the T1 and T2 mentioned in chart.
โข Educational purpose only. Happy trading.
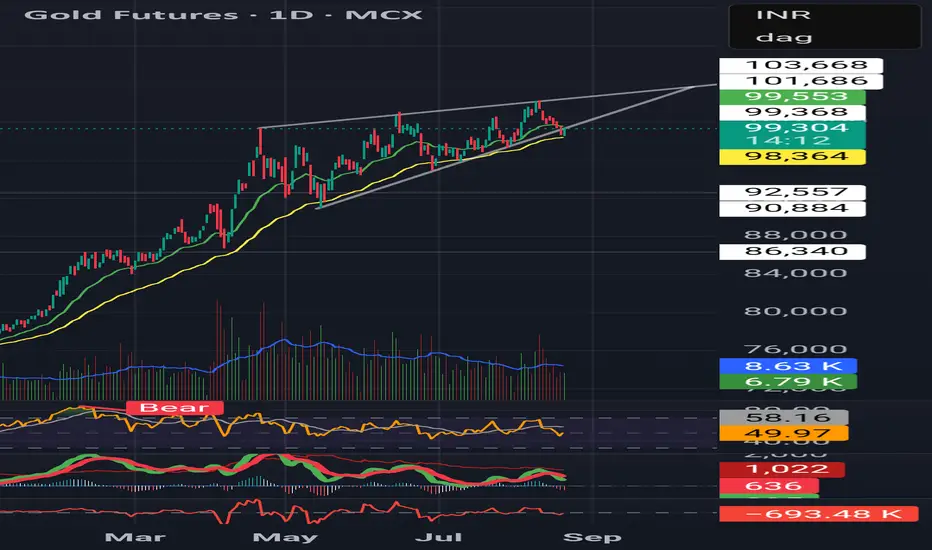
XAUUSD : FALLING WEDGE BOโข XAUUSD was moving in FALLING WEDGE channel from 5TH AUG.
โข A BO happens in last hour where market closed above the falling wedge
โข Long with a sl of 3331
โข Take profit should be 3400
โข A 1:5 RR
โข Idea is for educational purpose and explore the price action learning with trading psychology.
โข Have fun traders!!! ๐
M&M _ Rising Wedge Formation๐ M&M โ Technical & Educational Snapshot
Ticker: NSE: M&M | Sector: ๐ Auto
CMP: โน2,7XX (as of 16 Aug 2025)
Rating (for learning purpose): โญโญโญโญ
Pattern Observed: ๐ Rising Wedge Formation (Bearish Reversal Case Study)
๐ Key Reference Levels (For Learning)
Support / Breakdown Zone: Lower wedge trendline
Resistance / Rejection Zone: Upper wedge trendline
Bearish Projection (Case Study): ~โน2,410
Bullish Continuation (Alternative View): ~โน3,300
๐ Pattern Observations
โ
Price forming higher highs & h
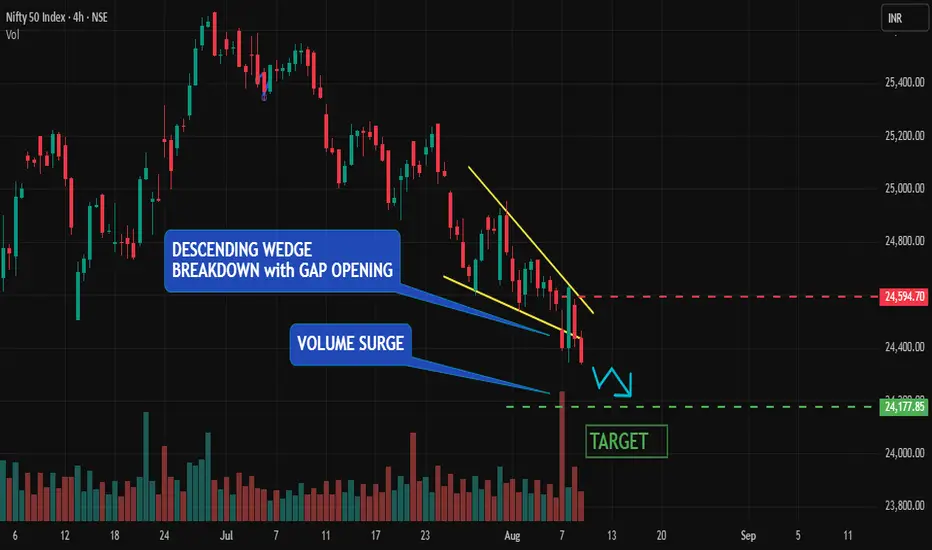
NIFTY BREAKDOWN CONFIRMED | BEARISH TARGETS ACTIVE!Nifty has already broken down from a well-formed descending wedge pattern on the 4-hour timeframe, backed by a strong volume spike โ a classic sign of institutional selling pressure .
Additionally, the MACD has turned decisively bearish , further confirming the momentum shift to the downside .
TRADE SETUP (ACTIVE IDEA)
โข Status: Breakdown already confirmed
โข Target: 24,177
โข Stop Loss: 24,594
โข Risk-Reward: Favorable short setup post-breakdown
TECHN
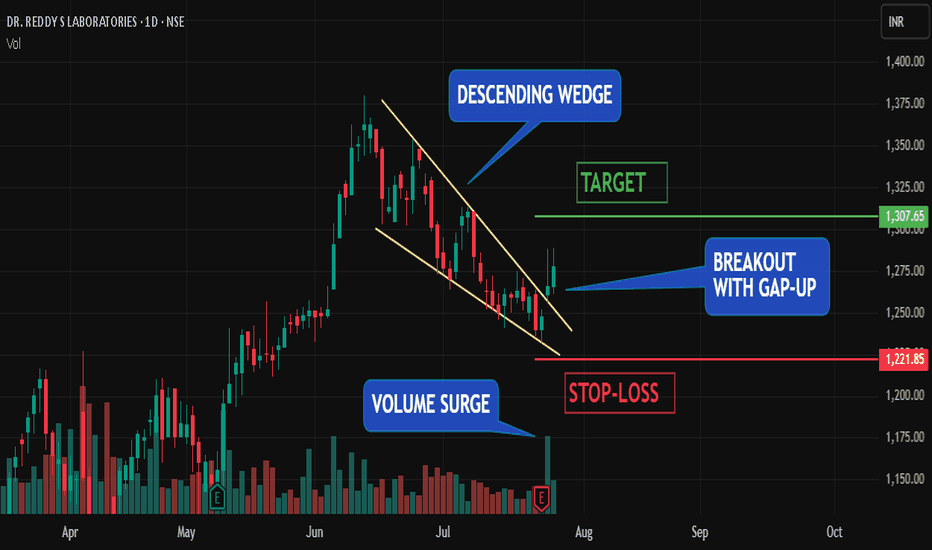
Dr. Reddyโs Breakout + Bullish Stochastic + Volume Surge = โน1307๐ TECHNICAL HIGHLIGHTS:
๐ DESCENDING WEDGE BREAKOUT:
Price has decisively broken above the wedge resistance, signaling a trend reversal.
๐ GAP-UP OPENING:
Signals aggressive buyer interest and bullish sentiment.
๐ STOCHASTIC OSCILLATOR:
Fast %K line has crossed above the slow %D line in the oversold zone, indicating momentum is shifting to the upside.
๐ VOLUME SURGE:
Heavy volume during breakout confirms strong buying pressure and likely institutional participation.
๐ฏ TRADE S
KAYNES TECHNOLOGY IND LTD โ Technical Analysis________________________________________
๐ง KAYNES TECHNOLOGY IND LTD โ Technical Analysis
Ticker: NSE:KAYNES | Sector: EMS & Semiconductors
Current Price: 6,172.00 โฒ (+9.5% on July 31, 2025)
Technical View: โญโญโญโญ | Chart Pattern: Falling Wedge Breakout
________________________________________
๐ Technical Overview
๐น Chart Pattern Formed: Falling Wedge Breakout with extremely high volume confirmation
๐น Breakout Zone: 6,000โ6,050
๐น Momentum Signals:
โ RSI breakout above 60
โ Strong bullish candle wi
Rising Wedge Breakdown โ 54,252 in Sight?#BankNifty View:
CMP: 56,528
BankNifty has broken down from a Rising Wedge pattern โ a bearish signal. After a brief retest of the breakdown level, price has resumed its downward move. Daily close below 56,205 will gather fresh momentum.
๐ A daily close below 56,205 could trigger fresh downside momentum.
๐ป Support Zones:
โข 56,283 โ 56,080
โข 55,580 โ 55,530
โข ๐ Key Supports: 54,470 โ 54,375 & 53,600 โ 53,580
๐บ Resistance Zone:
โข 57,312 โ 57,365
๐ฏ Pattern Target: 54,252
This a
Bharat RasayanโFalling Wedge Breakout with 39% Upside Potential!Hello Everyone, i hope you all will be doing good in your life and your trading as well! Today i have brought a post which is on Bharat Rasayan โ a classic case of a falling wedge breakout.
After staying in a falling wedge pattern for nearly 10 months, the stock has finally broken out with a strong bullish candle and a clear volume spike. This breakout zone (9900โ10200) also aligns with the downtrend line, making it even more valid.
The best part? This has participated in rally yet, means the
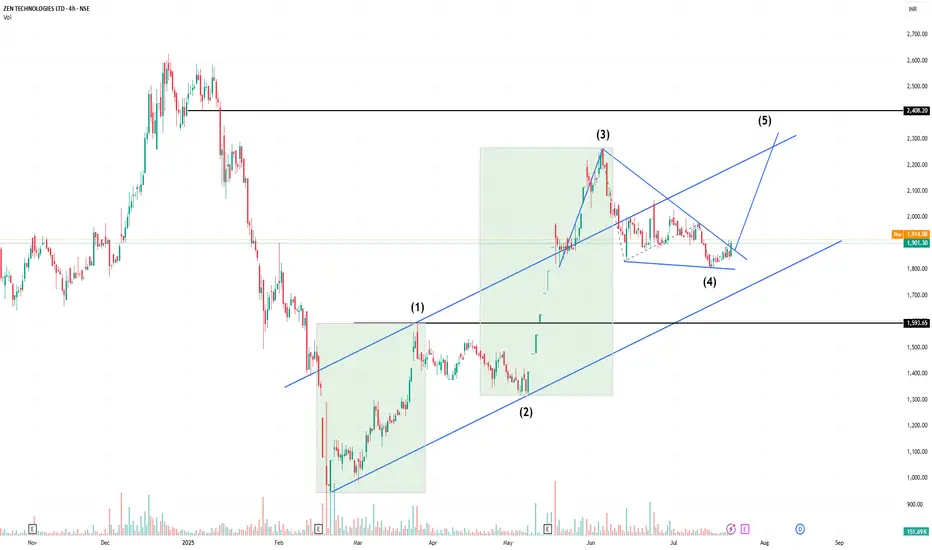
A Bullish Continuation Wedge + Elliott WaveIn NSE:ZENTEC the upward movement is likely to resume.
PLEASE NOTE THAT:
This chart analysis is only for reference purpose.
This is not buying or selling recommendations.
I am not SEBI registered.
Please consult your financial advisor before taking any trade
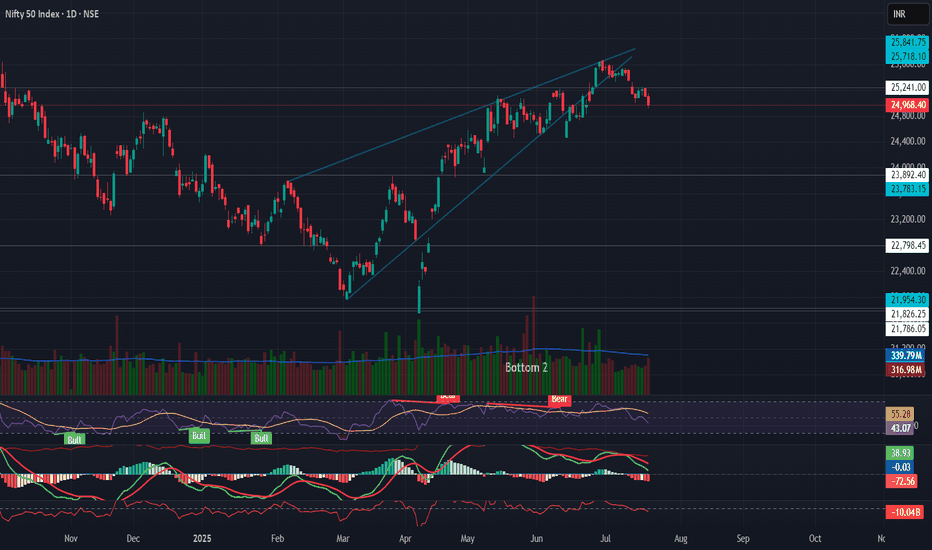
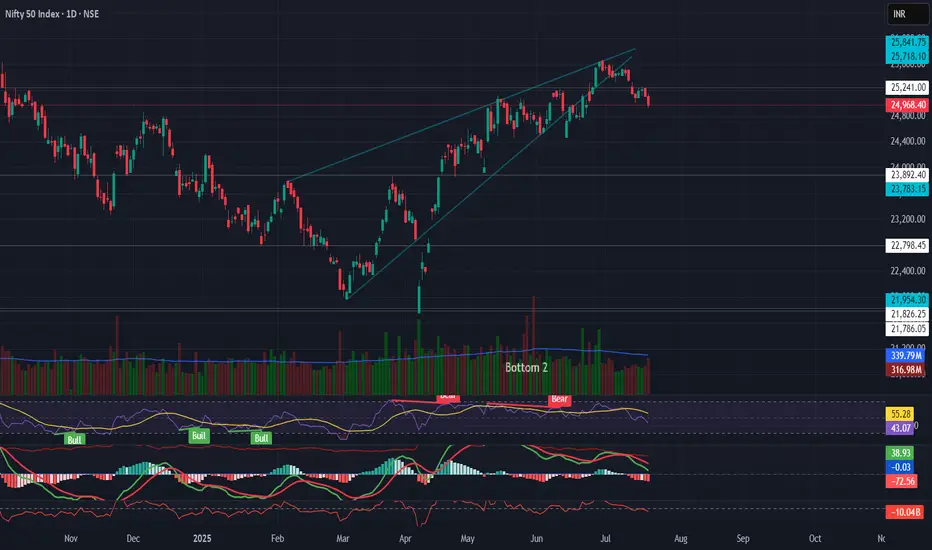
NIFTY Technical Breakdown โ Rising Wedge Pattern๐ป NIFTY Technical Breakdown โ Rising Wedge Pattern
The Nifty 50 has broken down from a rising wedge pattern on the daily timeframe, a bearish reversal formation that often signals distribution at the top.
๐ Key Observations:
Rising wedge breakdown after extended rally
RSI bearish divergence confirming weakness
MACD crossover turning negative
Volume gradually decreasing during the rise, indicating exhaustion
ADX flattening, showing weakening trend strength
๐ Support Levels to Watch:
23
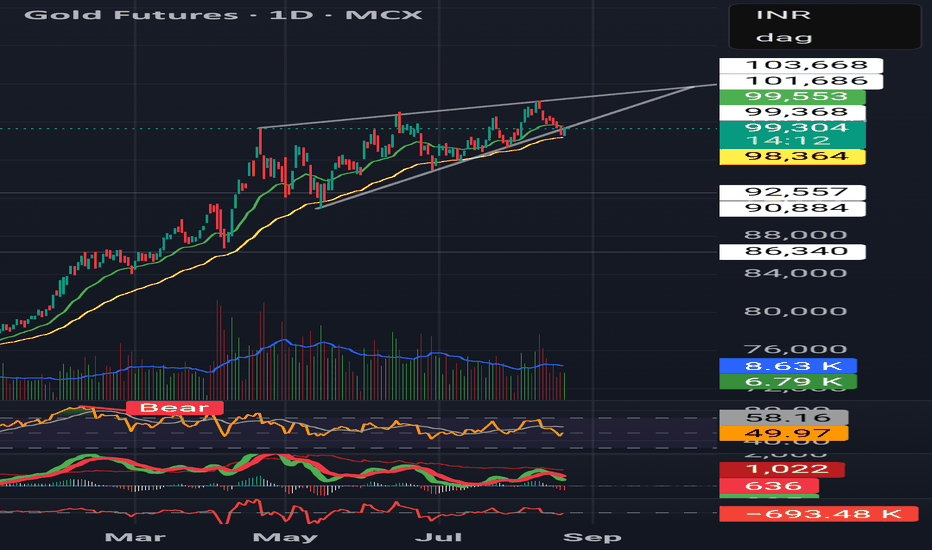
GOLD (XAUUSD) 4H Analysis โ Breakout Imminent from Rising Wedge!Gold is currently trading at 3353.39 after completing a well-defined ABCDE rising wedge structure on the 4H chart. The market is showing signs of exhaustion near the 3353โ3373 resistance zone, with a potential bearish rejection likely to follow.
๐ Key Highlights:
Pattern: Rising Wedge (ABCDE complete) โ a classic bearish reversal setup.
Sell Zone: 3353.88 to 3371.62 โ Expect high volatility and sharp rejection.
Target: 3296.36 โ Marked as the first major support zone.
Risk Management: Stron
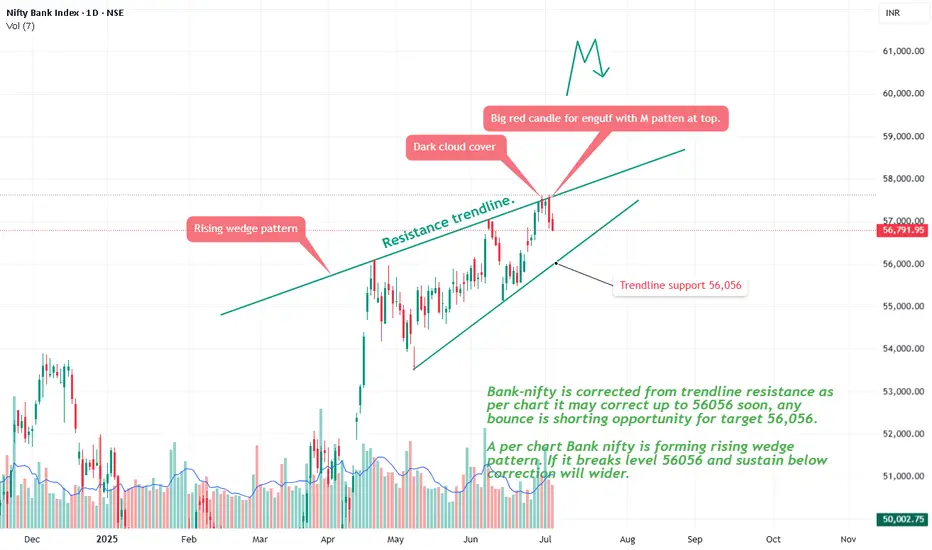
Bank nifty correction start now?Bank Nifty
Current Price: 56,791.95 (Spot)
Bank Nifty has reversed lower from the resistance trendline, confirming selling pressure near higher levels.
A Dark Cloud Cover candlestick pattern combined with an emerging M-top formation indicates potential short-term bearish sentiment.
It can short here or any bounce use as shorting opportunity for target 56,056
Major resistance is 57,400-57,700
The index is forming a rising wedge pattern, a bearish structure suggesting potential for deeper cor
Tech Mahindra Consolidates in a Wedge After Strong Support at KeTopic Statement:
TechM has been stuck in a consolidation zone, rebounding from strong support levels and forming a wedge pattern that may signal an upcoming breakout.
Key Points:
* The stock corrected up to the 30% Fibonacci retracement level, finding strong support around 1314
* It touched the 200-day moving average, which acted as a support and triggered a rebound
* The candlestick formation resembles a wedge, clearly marked on the chart with blue trend lines, indicating potential for a decis
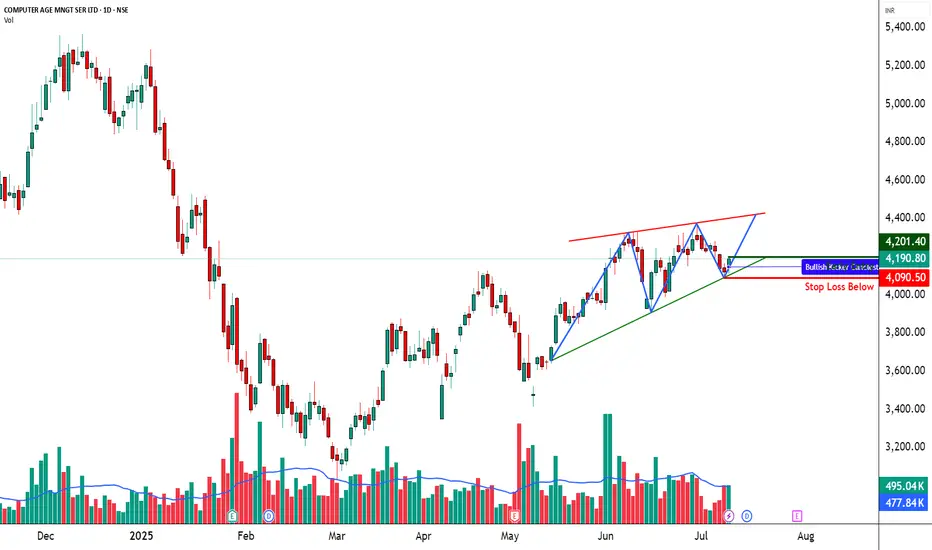
CAMS โ Rising Wedge in Focus ________________________________________________________________________________
๐ CAMS โ Rising Wedge in Focus
๐ Chart Type: Daily
________________________________________________________________________________
Whatโs Catching Our Eye:
CAMS is forming a Rising Wedge, a technical structure that often leads to strong directional moves. The price is nearing the upper boundary of the wedge, indicating possible breakout or reversal. This contraction in range is typically followed by expansion โ an
Bank nifty trading As per the current scenario of Bank Nifty chart as shown there is a rising wedge and Bank Nifty is running on the top resistance of this page. A fair possibility that it can cross the top resistance of a this wedge and proceed for new high.
Suppose it didn't, then the fall estimate will be off more than 3000 to 4000 points
So be cautious...wait for confirmation retracemet and change in polarity.