Wipro Trades in a Tight Wedge After Support-Led ReversalTopic Statement:
Wipro, a lagging IT stock, has shown signs of reversal after strong support at the 50% retracement level, with a wedge pattern hinting at a decisive breakout ahead.
Key Points:
* The stock retraced to the 50% Fibonacci level at 225, where it found strong support and reversed
* Price had dipped below the 180-day EMA during the correction, further reinforcing the significance of the support zone
* A wedge pattern is now forming, and a breakout on either side could define the next
Wedge
MGL: A study on wedge BO with 1:5 RR• MGL was consolidating in a tight range for the last 7 months.
• It has formed a rising wedge.
• Last 1 months showing significant volume buildup confirming big boys already entered in the trade.
• Today it broke out the wedge with significant volume and strong hourly closing.
• A massive 480 points move is possible in positional bases.
• All the T1 (gap border 1689) and T2 (1986) mentioned in the chart.
• SL for position should be 1425.
• Currently a RR opportunity of 1:5.
• Please note the da
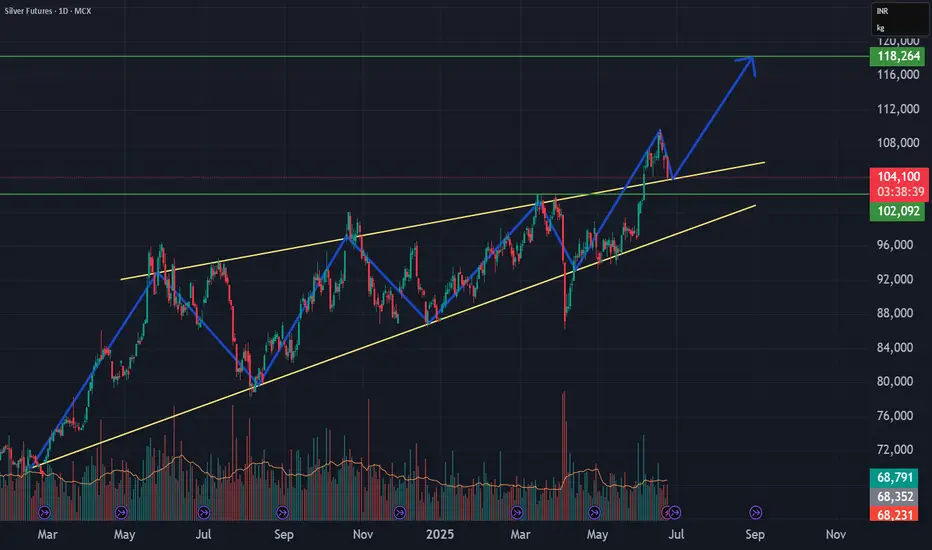
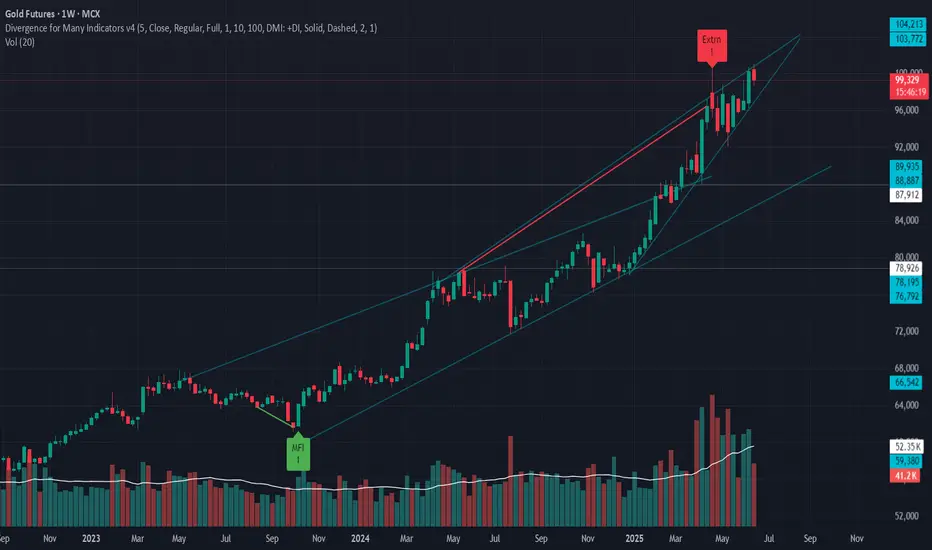
Gold Futures is forming a rising wedge with weakening momentum.
Gold is currently testing a rising trendline on the daily/weekly chart.
A trendline breakdown could signal a shift from bullish to corrective phase.
If the trendline breaks, the structure suggests:
Stop-loss: ₹101,000
Target 1: ₹90,000
Target 2: ₹86,000
This aligns with a potential retracement before the next macro wave (e.g., Fed rate cut cycle or global risk-off).
RPGLIFE | Falling wedge breakout ### 📊 **RPG Life Sciences Ltd - Technical Analysis Summary (Daily Chart)**
#### ⚡ **Breakout Observed**
* **Pattern**: Falling wedge breakout
* **Breakout Candle**: Strong bullish candle with \~6.88% gain on significant volume (107.98K)
* **Resistance Line Broken**: The upper descending trendline has been convincingly breached
#### 🎯 **Target Projection**
* **Measured Move**: ₹908.40 (from widest part of wedge)
* **Breakout Target**:
**Breakout Point**: ₹2,260 approx
**Target Price**: ₹2
MGL: Rising Wedge Breakout Sets Stage for Explosive RallyNSE:MGL : Rising Wedge Breakout Sets Stage for Explosive Rally after management guidance of double-digit volume growth for the next three to four years.
Price Action Analysis:
• Stock has formed a classic Rising Wedge pattern from November 2024 lows around 1,075 to current levels near 1,433
• The wedge shows converging trendlines with higher highs and higher lows, typical of consolidation before a breakout
• Recent breakout above the upper trendline around 1,400 levels confirms bullish momen
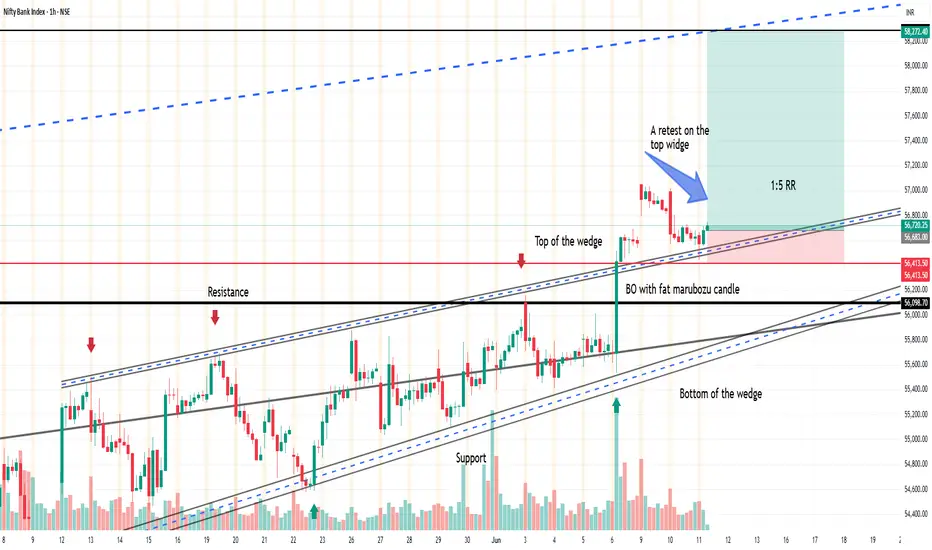
Banknifty : Rising wedge break out with liquidity trap• BN was trading in a rising wedge from 7th May.
• An event of liquidity trap for the sellers occurs on 9th of May when market traded below the wedge.
• A Marubozu candle on 12th May opening indicate the big boys wants to move the BN upward and grab all the seller's liquidity.
• A higher high pattern is clearly visible on the rising wedge with resistance and support trendline.
• A consolidation of approximately one month indicates accumulation phase.
• 06th of June opening candle broke the wedge
Emudhra Watchlist StockEmudhra's Triangle Breakout Drama: Why This Digital Security Stock Could Rally 15% from Current Levels
Price Action:
Looking at Emudhra's daily chart, we're witnessing a textbook technical setup that could offer substantial rewards for patient traders. The stock has been consolidating in a well-defined triangle pattern since late April, with price action compressed between converging trend lines around 720-780 levels.
The current price action shows Emudhra testing the upper boundary of this
Sensex - Expiry day analysis June 3Today price took support at 80650 zone and moved up. 81400 - 81500 will act as resistance and price should sustain above it to move up.
Buy above 81160 with the stop loss of 81060 for the targets 81260, 81380, 81460, 81600, 81720 and 81860.
Sell below 80900 with the stop loss of 81000 for the targets 80800, 80680, 80580, 80480, 80360, 80220, 80160 and 80080.
Expected expiry day range is 80100 to 81700.
Always do your own analysis before taking any trade.
CDSL – Leading Diagonal Kicking Off a Bullish Cycle?A possible new bullish impulse may be forming in CDSL, following a strong corrective downtrend.
From the ATH at ₹1989.80, the stock completed a 5-3-5 Zigzag correction that bottomed out at ₹1047.45. The final leg (Wave C) shows the characteristics of an Ending Diagonal , signaling possible exhaustion and the end of the correction.
From that low, the structure that follows appears to be a Leading Diagonal , possibly acting as Wave 1 of a new motive sequence. Despite its expanding nature,
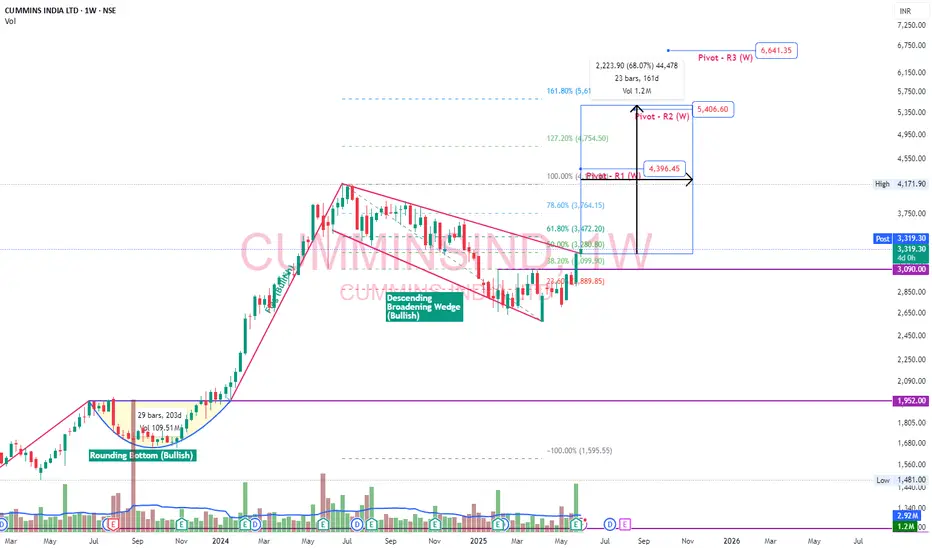
CumminsInd - Desc Broadening Wedge - BullishCumminsInd - Capital goods Non Electrical Equipment
Despite modest Q4 revenue growth, Cummins India expects double-digit growth in FY26 on the back of robust domestic demand, CPCB 4+ tailwinds, and export recovery
Chart is making Bullish flag with descending broadening Wedge bullish pattern in weekly timeframe
Fib level 161.8%, Pivot R1(W), Pivot R2 (W) will hold as resistances
Tata Teleservices (Maharashtra) Big breakout alert!Big Breakout Alert!
Price has convincingly broken out of a long-term descending trendline with high volume interest visible on the volume profile — signaling a potential change in trend.
🔹 CMP: ₹65.88 (▲ +13.14%)
🔹 Resistance levels: ₹79.00 → ₹104.00
🔹 Support zone: ₹54.10 (Volume Node & Horizontal Structure)
🔍 Technical Insights:
Volume Profile Analysis
🔸 High volume node between ₹54–₹66 suggests strong accumulation.
🔸 Sharp price rejection below ₹54 confirms it as a demand zone.
Descen
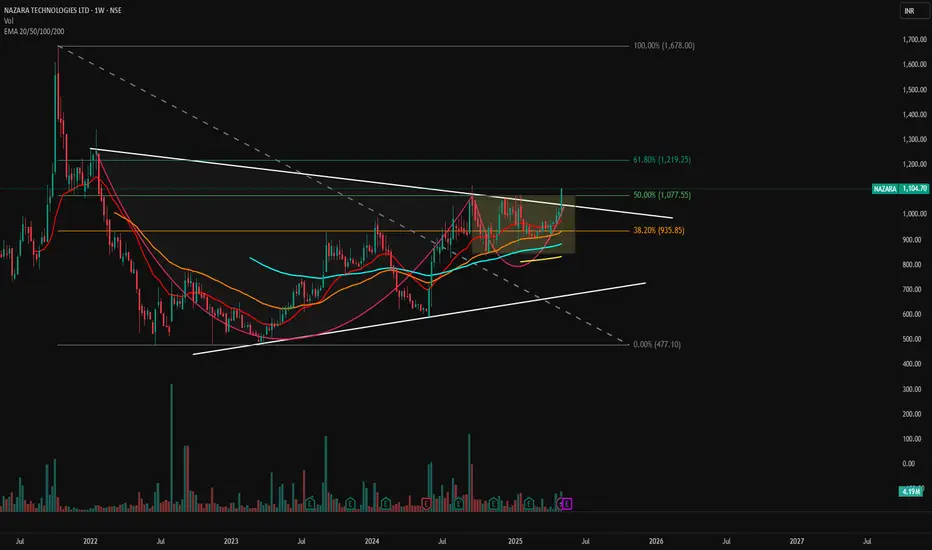
NAZARA - Breakout from Long-Term Falling Wedge📊 NAZARA – Breakout from Long-Term Falling Wedge | Strong Weekly Momentum
🕰️ Timeframe: Weekly | 💥 Pattern: Falling Wedge Breakout | 🔥 Sentiment: Bullish
📈 Chart Overview:
Nazara Technologies has broken out of a multi-year falling wedge on the weekly chart, with a strong green candle above key EMAs and Fibonacci confluence zones. Price closed the week above ₹1,100, indicating a shift in long-term momentum and a potential start of a fresh uptrend.
🔍 Technical Highlights:
📉 Falling Wedge Pattern
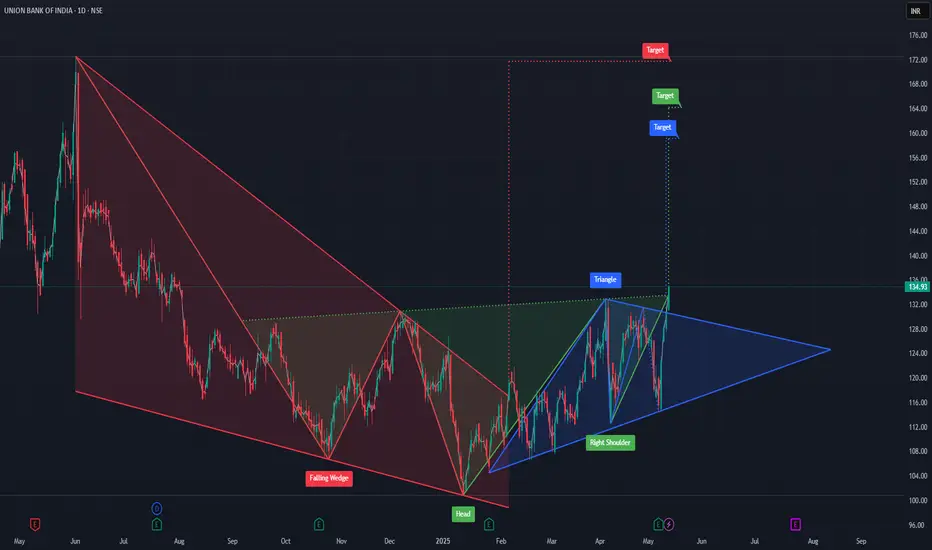
UNION BANK OF INDIA – TECHNICAL ANALYSISUnion Bank just flashed a powerful confluence of 3 bullish patterns and smart money could already be moving in. Let’s break it down simply, but sharply
1. Falling Wedge Breakout (Aug ‘24 – Feb ‘25)
Falling Wedge is one of the strongest bullish reversal signals in technical analysis.
✔️ Price kept dipping but volume dropped — a sign of seller exhaustion.
✔️ It broke out with power in Feb, confirming buyers are gaining control.
2. Inverse Head & Shoulders (Smart Money Footprint)
This classic
Time Technoplast – Compression Before Expansion?Chart Pattern Combo: 🔻 Falling Wedge inside 🔺 Symmetrical Triangle
CMP: ₹344 | Target: ₹493 (43% Upside)
📈 What’s Happening?
This setup is a classic case of pattern convergence — where price action + psychology meet:
🔹 Symmetrical Triangle → Signals price is coiling and preparing for a breakout
🔹 Falling Wedge Breakout → A bullish reversal pattern, already active
🔹 Strong Bounce from demand zone ₹303–₹307 confirms buyer interest
🔹 Immediate resistance at ₹352 — a breakout above this could tr
Polycab - Descending Broadening WedgeCables have good demand. Polycab making bullish breakout from descending broadening wedge pattern and the subsequent targets are 5528.50, 5929.85, 6403.60 and the weekly pivot is at 6494.00. Around this level is 61.8% fib level 6427.55 so there is more supply (selling) in this point.
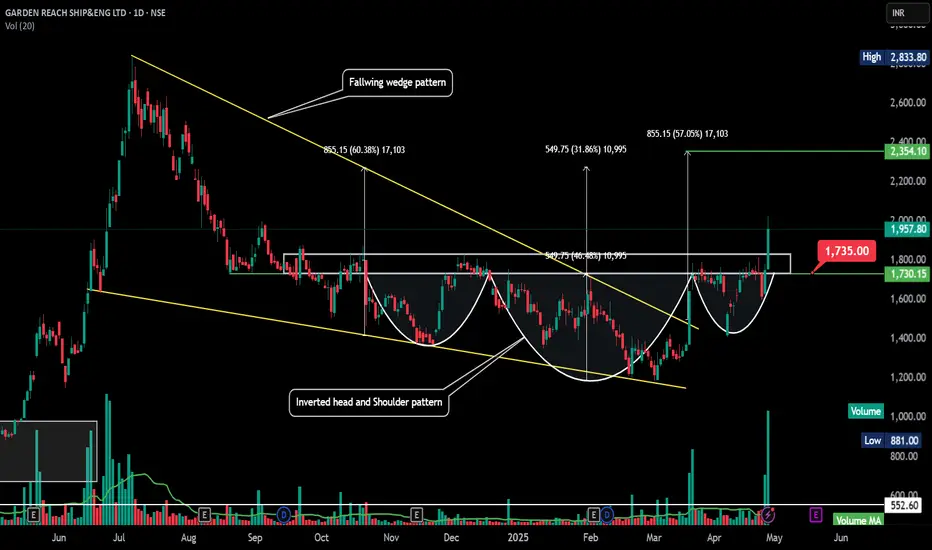
Garden Reach Shipbuilders (GRSE) Bullish Inv HnS BO with volumeThanks for sharing the chart of **Garden Reach Shipbuilders (GRSE)**.
Strong **bullish setup** supported by two technical patterns:
1. **Falling Wedge Pattern (Breakout)** – A classic bullish reversal pattern, and it has broken out with strong volume.
2. **Inverted Head and Shoulders** – Another bullish reversal formation that also broke out around ₹1,730–₹1,750 zone, confirmed with high volume.
### Key Highlights:
- **Breakout Confirmation**: Price closed at ₹1,957.80, up **+11.90%**, with s
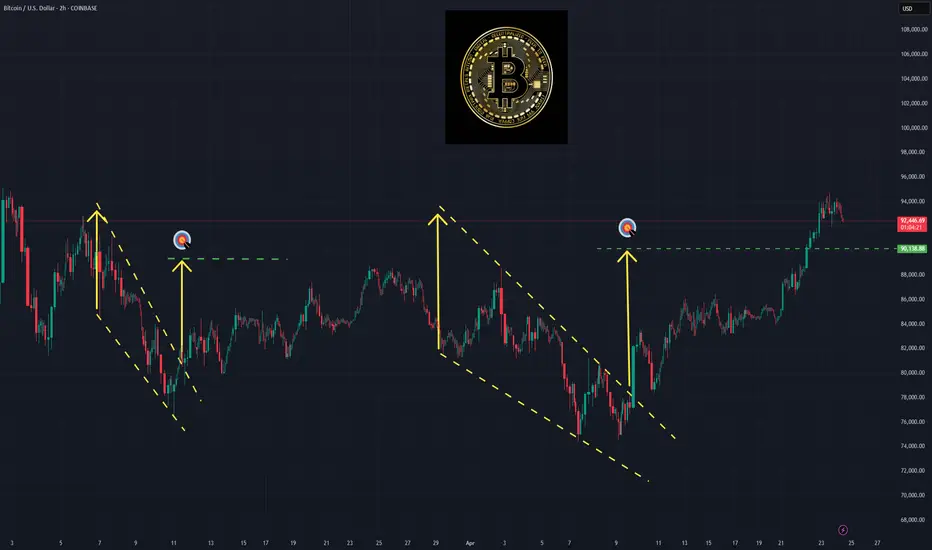
Real Success Rates of the Falling Wedge in TradingReal Success Rates of the Falling Wedge in Trading
The falling wedge is a chart pattern highly valued by traders for its potential for bullish reversals after a bearish or consolidation phase. Its effectiveness has been extensively studied and documented by various technical analysts and leading authors.
Key Statistics
Bullish Exit: In 82% of cases, the exit from the falling wedge is upward, making it one of the most reliable patterns for anticipating a positive reversal.
Price Target Achieve
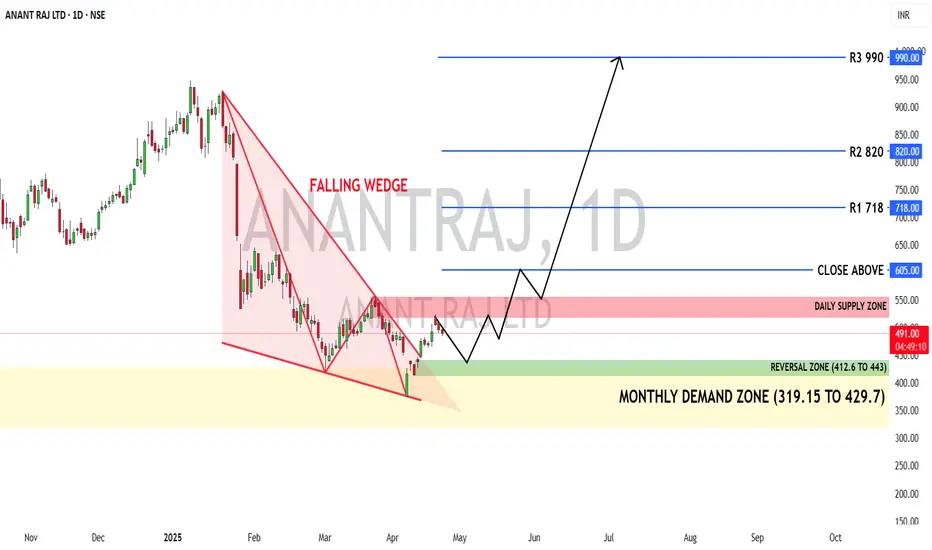
Anant Raj Ltd: Reversal in Sight with Strong Fundamentals🏢 Company Overview
Anant Raj Ltd is a leading real estate developer in India, focused on residential, commercial, and industrial infrastructure projects, primarily in the NCR. The company has consistently demonstrated strong execution, strategic land holdings, and diversified income streams.
📊 Fundamental Snapshot (FY 2023–24)
✅ Revenue & Profitability
Revenue: ₹1,961.91 Cr (+55% YoY)
Net Profit: ₹385.23 Cr (+72.65% YoY)
EPS: ₹11.27 (+68.29% YoY)
Operating Margin: 64.24%
Net Profit Ma
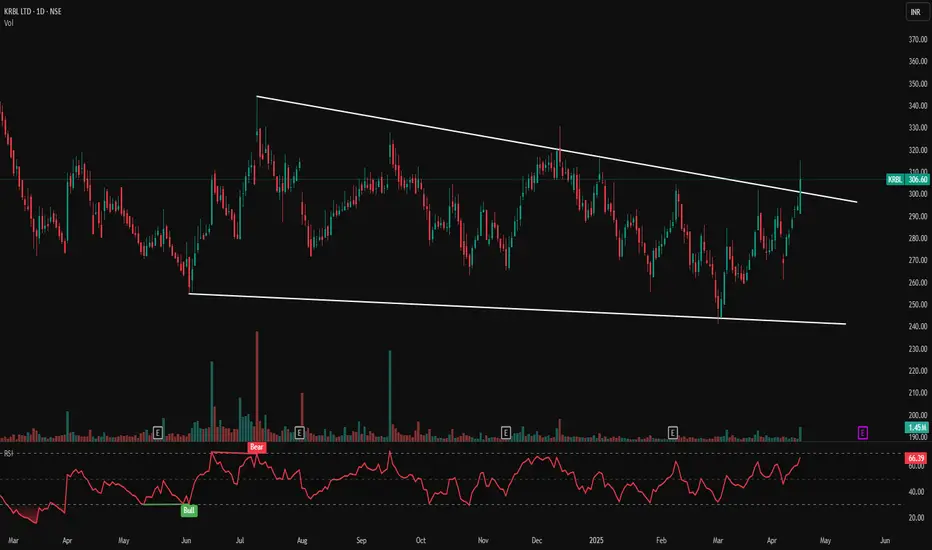
KRBL LTS- Falling Wedge Breakout | Trend Reversal Signal Ahead?KRBL LTD – Falling Wedge Breakout 💥 | Trend Reversal Signal Ahead?
📅 Published on: April 17, 2025
📈 Technical Analysis:
KRBL has shown a bullish breakout from a long-term falling wedge pattern on the daily chart — a classic reversal pattern signalling a potential upward move after prolonged consolidation. The breakout candle is supported by strong volume and a bullish RSI setup.
Pattern: Falling Wedge (Bullish)
Breakout Price: ₹306.60
Previous Resistance Line: Now acting as support
Breakout Vo
Sky Gold’s Breakout: Falling Wedge Pattern Points to Big Upside!Hello everyone, i hope you all will be doing good in your life and your trading as well. Today i have brought a stock name with Sky Gold & Diamonds and it is showing a promising Falling Wedge pattern, and with the breakout above the upper boundary, it’s signaling a potential bullish move ahead. The breakout is supported by a volume surge, which suggests smart money may be entering, reflecting strong market interest. This could be the start of a solid rally.
On the fundamental side, Sky Gold has
Bank Nifty showing a bullish wedge pattern in this bear market.NSE:BANKNIFTY showing a bullish pattern ( see attached image) will it break to the upside? We will know by coming week. Compare to $NSE:NIFTY.
Bank nifty looking strong despite heavy selling across world market. Intresting.
This is just for price action educational purpose and not for any buy or sell reccommedations.