EURUSD looking super bearish long termEURUSD somehow not able to sustain at the higher levels falling from the bearish wedge pattern. Creating multiple tops and not looking confident at higher level. RSI is also suggesting more selloff pending from the current levels. Uptrend will only positive if it sustains above 1.06300. Otherwise i can see it is ready to hunt the liquidity levels of 0.974 0.964 0.953
Wedge
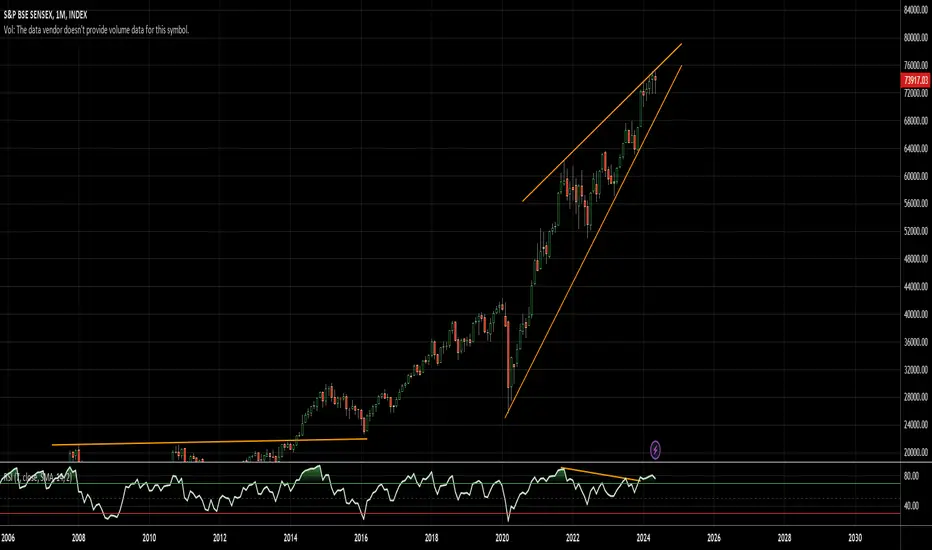
The Mirage of Eternal Growth: Nifty, Sensex in 2024INDEX:SENSEX
In the realm of stock markets, where optimism can often overshadow caution, the upward trajectory of indices like the Nifty and Sensex can be both alluring and deceptive. For the past eight years, these indices have exhibited an unbroken streak of growth, painting a picture of perpetual prosperity. However, beneath the surface lies a pattern that portends caution rather than celebration – the rising wedge pattern.
The Nifty and Sensex, the barometers of India's economic health,
Nifty 50 Ready for 24200?📊 Nifty 50 Daily Analysis
🔸 Current Resistance:
Nifty is facing resistance at the 50 DMA and the top of the wedge pattern.
🔸 Market Structure:
The structure remains Lower Highs (LH) and Lower Lows (LL), keeping the bearish trend intact.
🔸 Key Support Levels:
Pivot 1: 23,534 (must hold for bullish momentum).
Recent Swing Low: 22,783 (breaking this could push Nifty down to 21,800).
🔸 Upside Potential:
If Nifty consolidates tightly above Pivot 1 with small candles, a breakout could happen with
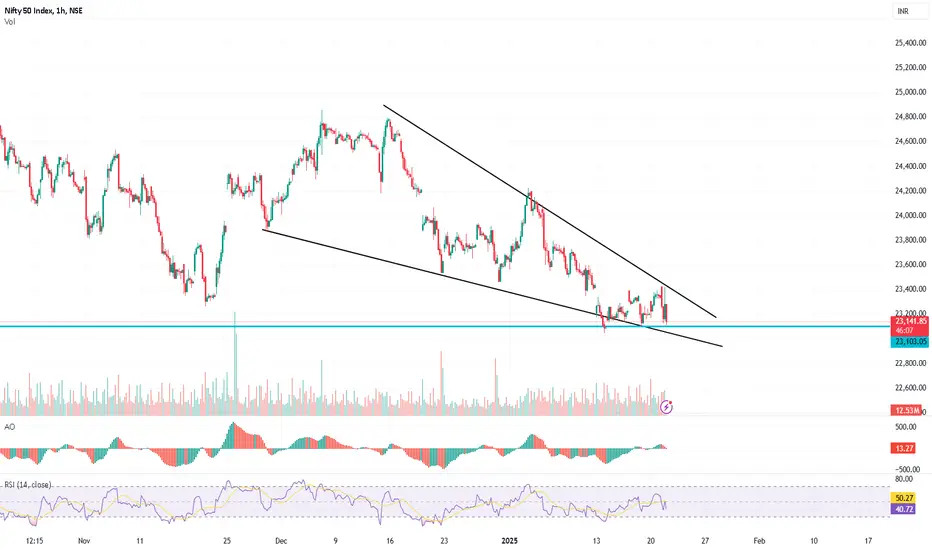
Nifty 50 | Falling Wedge Pattern – A Bullish Breakout Ahead?Hello everyone! I hope you all are doing great in life and in your trading journey. Today, I have brought an in-depth analysis of Nifty 50 , focusing on a powerful Falling Wedge Pattern that is currently forming on the charts. This pattern is known for signaling a bullish reversal , provided we get a confirmed breakout . If this pattern plays out as expected, we could witness a strong upward move in the coming sessions.
Currently, Nifty is trading near a strong support zone around 22,77
Persistent Systems: Bull Run with Breakout Potential Topic Statement: Persistent Systems is on a strong bull run, showing resilience to the market correction, with a wedge pattern signaling a potential breakout.
Key Points:
1. The stock receives heavy support near the 180-day moving average, making it a good entry point.
2. Candlesticks are forming a wedge pattern, indicating a big directional move upon breakout.
3. The price faces heavy resistance at the ₹6500 level.
4. Company reported a 30% profit growth QoQ.
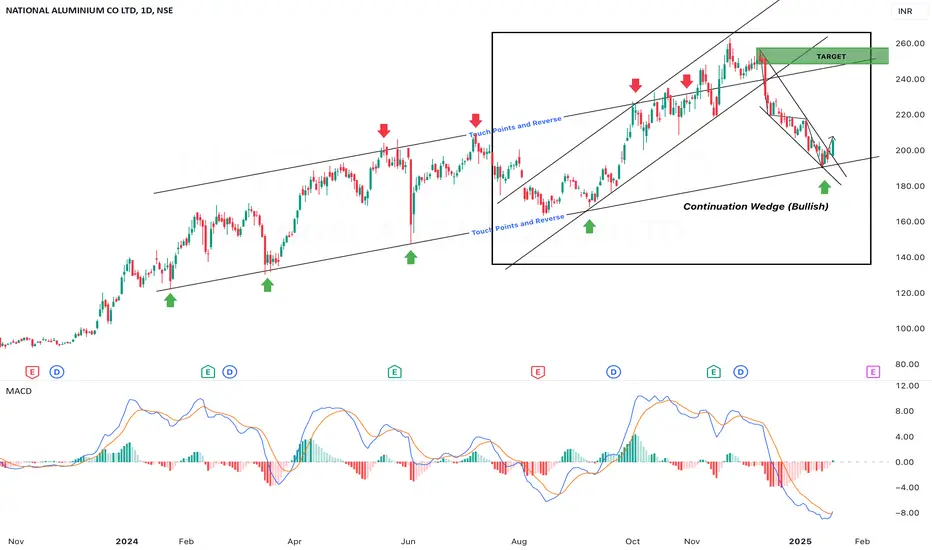
National Aluminum Co Ltd - Looks Good.Candidate looks good for swing trade with target of 240 INR. and S/L of 180 INR. CMP 205.54 INR.
Reason
Swing Trade
Touch Point reversal
MACD Cross Over
Continuation Wedge (Bullish) Pattern formation
PLEASE NOTE THAT:
This chart analysis is only for reference purpose.
This is not buying or selling recommendations.
I am not SEBI registered.
Please consult your financial advisor before taking any trade.
Bank Nifty - Is this A Rising Wedge from 47898 As discussed early morning .... 49000 was our key & psychological level ... Index dropped & came close to 48500-48600 zone
Falling From 49000 Level
Support Zone 48500-48600
Makar Sankranti marks the Sun's transition into Capricorn and the beginning of an auspicious period. Historically, equity markets turn optimistic post-Makar Sankranti, driven by cultural sentiment and Budget expectations. Will Budget 2025 keep the trend alive? 🌞
This comes after a 26-day fall in major benchmark
Sensex - Jan 14 expiry day analysisWe had a nice down trend today. May be it will lead to range movement tomorrow. Anyhow let us plan the trade.
Range move is possible in the zone 76200 to 76400. Price have to sustain above 76500 to be bullish. Buy above 76540 with the stop loss of 76420 for the targets 76640, 76740, 76860, 76980 and 77120. Sell below 76260 with the stop loss of 76360 for the targets 76160, 76040, 75920, 75800, 75680, 75540 and 75400.
Do your own analysis before taking any trade.
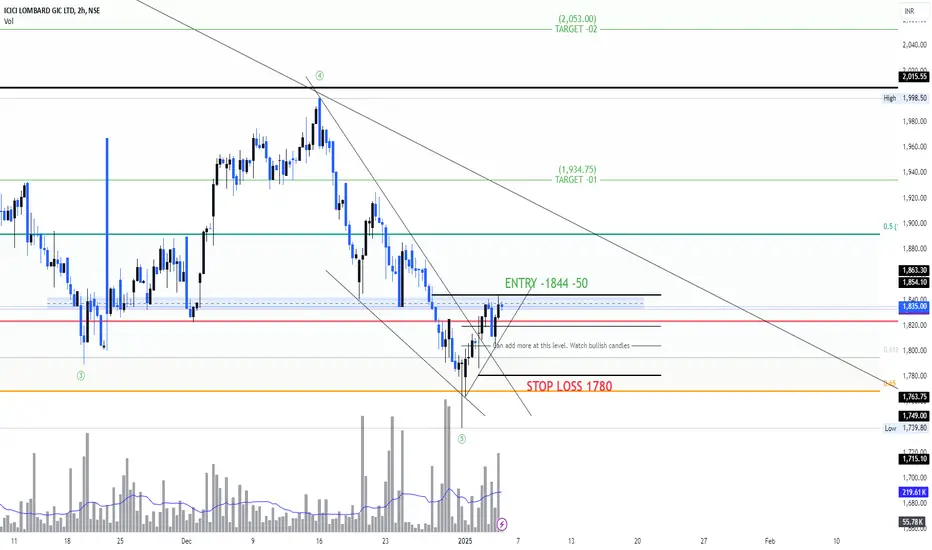
ICICIGI - Trend Reversal ? ICICI Lombard General Insurance Company Ltd is a leading private sector general insurance company in India.
Technical Analysis:
Weekly: Bullish Harami
Daily Time Frame: Hammer formed on 3rd Jan, volume slightly up
Publishing 2-Hour Chart, as Overall market trend is negative/downtrend. Observe the chart for trendline breakout. On weekly, it's near the 0.65 level, which is crucial. Entry points are mentioned in the chart.
Please share your view.
BTC.D Breakdown Signals Start of Altcoin SeasonBTC.D has broken its rising wedge support and retested the lower wedge support, which is now acting as resistance. Additionally, the MA 50 and MA 200 have formed a bearish cross, signaling a potential decline of CRYPTOCAP:BTC.D at least 10%. This scenario could trigger altcoin rallies, potentially delivering returns of 5x to 25x, marking the start of the altcoin season.
Banknifty Fibonacci Time zones Analysis📊 Fibonacci Time Zones: A Gateway to Market Timing 🕰️
The Fibonacci Time Zone Tool is a unique and powerful feature in TradingView, based on the mathematical sequence introduced by Leonardo Fibonacci, a 13th-century Italian mathematician. Widely used in financial markets, this tool helps traders identify potential time-based turning points.
🔑 How It Works:
By plotting three key points—two highs and one low (or vice versa)—this tool extends Fibonacci ratios (0, 0.618, 1, 1.618, etc.) as vertica
SAPANDANA SPHOORTY READY FOR ALL TIME HIGH ?NSE:SPANDANA (Spandana Sphoorty Fin Ltd.)
This can be considered as my New Year Pick !!
Yesterday, Longs were given around 375
Mentioning that Any dip till 300 to be bought !
For Targets🎯400 / 425 / 444 / 462 / 488 / 505 / 520++
POSITIONAL TARGET🎯 555 / 578 / 606++
Keeping WCBSL as 284
Chart which was made yesterday ie. 07/01/2025
Today, It made a high of 480++
375------>480++
T4 Done🎯🎯
More Than 25% Returns in single session !!💕😍
Updated Chart as of now ie. 08/01/2025
This mov
NIFTY BANK: Will It Bounce Back or Continue Falling? NIFTY BANK remains trapped in a falling channel, with key support and resistance levels coming into play. As the price consolidates, traders are watching closely for signs of a breakout or further downside movement.
Key Points:
1. Resistance Zones:
- 50,926.75
- 50,689.45
- 50,444.40
- 50,204.15
2. Support Levels:
- 49,957.80
- 49,721.60
- 49,473.10
- 49,259.55
3. Current Setup:
- NIFTY BANK is trading within a falling channel, indicating b
RAMAPHO - Breakout TradeView : Bullish
Entry Zone- 240- 200 (Trend line breakout falling wedge)
Exit Zone - Based on Trader mindset. Exit 1 - 270
Exit 2- 307
Exit 3 - 350
Stoploss : Close below 190
Trading Edge: Price action and CPR
Timeframe: Daily and Weekly
Notes: Trendline breakout of falling wedge pattern. Price consolidates since Feb 2023.
NIFTY: Oversold with Potential for a Big MoveTopic Statement: NIFTY has corrected severely, trading below the 180-day moving average and forming a wedge pattern that signals a potential big move.
Key Points:
1. The price is under the 180-day moving average, making NIFTY oversold.
2. Candles are forming a wedge pattern, indicating a significant move upon breakout.
3. Gaps at the 25000 level suggest the market may eventually rise to fill them.
3 Hotel Stocks - Ready to Rock!! Breaking Out!!Happy New Year to everyone!!! Let 2025 be the best !!!
Today I have brought Basket of 3 Hotel Stocks, which looks super good fundamentally & technically. Expecting a good upside - invest in this basket. Other factors:
Lemon Tree:
1. 110 places in India and touching every segment
2. Looking to ATH breakout
Chalet Hotels:
1. From the group of K Raheja which has iconic hotels - JW Marriot Mumbai, Westin Mumbai, Dutch Treats, etc.
2. Already given a breakout and retested as well
The Park:
1.
HDFC AMC: Wedge Pattern Awaits Breakout DirectionTopic Statement: HDFC AMC is subdued in a range of 4100 to 4600, with a wedge pattern signaling a potential breakout that could dictate its next directional move.
Key Points:
1. A wedge pattern formation indicates a breakout could lead to a significant price movement.
2. Strong support at 4200 and resistance at 4500 shape the stock's current dynamics.
BALKRISIND - Breakout in Falling WedgeView : Bullish
Entry Zone- 2860- 2800 (Trend line breakout)
Exit Zone - Based on Trader mindset. Exit 1 - 2935
Exit 2- 3050
Exit 3 - 3300
Stoploss : Close below 2750
Timeframe: Daily
Notes: Trednline break out the Falling wedge pattern. Price consolidates since May 2024.