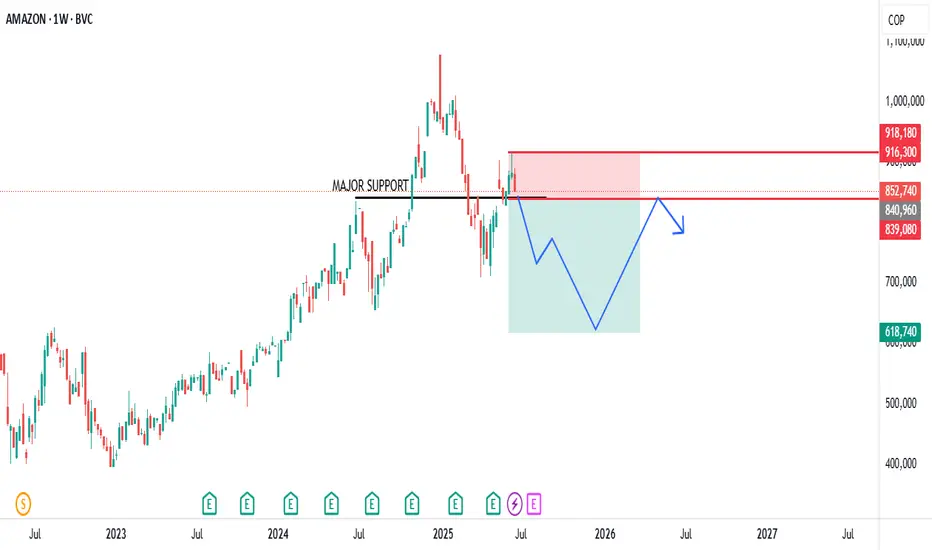
Amazon on shot high selling pressureThe chart depicts the weekly price movement of Amazon (AMZN) stock from 2022 to mid-2025, with a focus on a recent period around June 2025. Here’s an analysis based on the provided chart:
Historical Trend: The stock experienced a significant upward trend from 2022 to mid-2024, showing consistent growth with periodic corrections. This suggests strong bullish momentum over the long term.
Major Support Level: A key support zone is identified around the $916.18 to $919.18 range (highlighted in red
 Short