Updated
Regime Range Filter - Dynamic RSI Bands
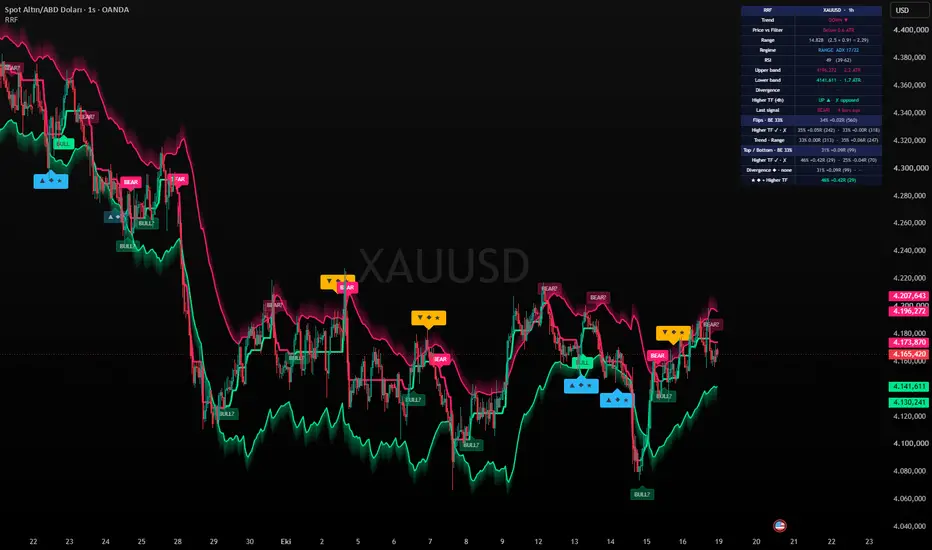
Regime Range Filter - Dynamic RSI Bands [RRF]
══════════════════════════════════════════════
ACIKLAMA (Description) - TradingView'a bu kismi yapistir
══════════════════════════════════════════════
RRF combines three things on one chart: a range filter for trend direction, RSI bands converted to price, and a reversal engine that looks for tops and bottoms at those bands. Its main feature is a statistics panel that measures every signal it prints, so you can see on your own symbol and timeframe which signals actually work.
HOW IT WORKS
Range filter
The line only moves when price travels a multiple of its average bar-to-bar move. When the line changes direction, a BULL or BEAR label is printed. The range can be based on close-to-close movement (Classic) or on ATR. An optional dynamic multiplier can widen or narrow the range using ADX, RSI and relative volume, each ranked against its own history.
Dynamic RSI bands
Instead of fixed 70/30, the overbought and oversold levels are percentiles of RSI's own recent distribution. Each level is then converted into the price that the next bar would need to reach for RSI to touch it. In a strong trend the bands shift with the trend.
Reversal engine
▼ Top: price touched the upper band within the last few bars, then a red candle closed back inside the band and below the previous candle's midpoint.
▲ Bottom: the mirror image at the lower band.
◆ means an RSI divergence is present (price made a new extreme, RSI did not).
★ means divergence AND alignment with the higher timeframe.
Each reversal has its own stop (just beyond the swing extreme) and a target in R, shown in the label tooltip.
Higher timeframe filter
Signals are compared with the range filter of one higher timeframe (1h -> 4h, 4h -> Daily, and so on). The higher timeframe is always read from its last closed bar, so it does not repaint. Signals against it can be shown faded (Soft), hidden (Hard) or ignored (Off).
STATISTICS PANEL
Every raw signal - including the ones the filters hide - is followed until it reaches its target or its stop. If both are touched on the same bar it counts as a loss. Results are shown as hit rate and average R per trade, split by regime, higher timeframe alignment and divergence.
The "Statistics start date" setting counts signals from a chosen date in a separate set. Set it to the day you stop changing settings: that set is then data your settings were never tuned on.
How to read it: R is the main measure. A split is worth trusting only with at least 40 samples per group, a clear R difference, and the same difference on another symbol. Results differ a lot between markets and timeframes - in testing, a filter that helped on one market did nothing or the opposite on another. Check the panel on your own chart before relying on any signal.
NOTES
- Signals are confirmed on bar close by default and do not disappear afterwards.
- Works on the free plan (one request.security call).
- Settings are in English; the panel can be switched to Turkish.
- This is an analysis and measurement tool. Past statistics do not guarantee future results, and nothing here is financial advice.
CREDITS
- Range filter formula: the open-source "Range Filter" by guikroth / DonovanWall, re-implemented.
- RSI-to-price inversion: Giorgos Siligardos, "Reverse Engineering RSI" (TASC, 2003).
- Inspired by Adaptive Range Filter (MarkitTick) and RSI Master (SimpleAlgo). No code from either was used.
──────────────────────────────────────────────
TURKCE
──────────────────────────────────────────────
RRF; trend yonu icin range filter, fiyata cevrilmis dinamik RSI bantlari ve bu bantlarda tepe/dip arayan bir donus motorunu tek grafikte birlestirir. Asil ozelligi istatistik panelidir: bastigi her sinyali olcer ve hangi sinyalin senin sembolunde ve periyodunda gercekten calistigini gosterir.
▼ Tepe / ▲ Dip: banda temas + ret mumu. ◆ = RSI uyumsuzlugu. ★ = uyumsuzluk + ust zaman dilimi uyumu.
Panelde asil olcu R'dir. Bir sonuca guvenmek icin her grupta en az 40 ornek, belirgin R farki ve ayni farkin baska bir sembolde de cikmasi gerekir.
Bu bir analiz ve olcum aracidir; yatirim tavsiyesi degildir.
══════════════════════════════════════════════
ACIKLAMA (Description) - TradingView'a bu kismi yapistir
══════════════════════════════════════════════
RRF combines three things on one chart: a range filter for trend direction, RSI bands converted to price, and a reversal engine that looks for tops and bottoms at those bands. Its main feature is a statistics panel that measures every signal it prints, so you can see on your own symbol and timeframe which signals actually work.
HOW IT WORKS
Range filter
The line only moves when price travels a multiple of its average bar-to-bar move. When the line changes direction, a BULL or BEAR label is printed. The range can be based on close-to-close movement (Classic) or on ATR. An optional dynamic multiplier can widen or narrow the range using ADX, RSI and relative volume, each ranked against its own history.
Dynamic RSI bands
Instead of fixed 70/30, the overbought and oversold levels are percentiles of RSI's own recent distribution. Each level is then converted into the price that the next bar would need to reach for RSI to touch it. In a strong trend the bands shift with the trend.
Reversal engine
▼ Top: price touched the upper band within the last few bars, then a red candle closed back inside the band and below the previous candle's midpoint.
▲ Bottom: the mirror image at the lower band.
◆ means an RSI divergence is present (price made a new extreme, RSI did not).
★ means divergence AND alignment with the higher timeframe.
Each reversal has its own stop (just beyond the swing extreme) and a target in R, shown in the label tooltip.
Higher timeframe filter
Signals are compared with the range filter of one higher timeframe (1h -> 4h, 4h -> Daily, and so on). The higher timeframe is always read from its last closed bar, so it does not repaint. Signals against it can be shown faded (Soft), hidden (Hard) or ignored (Off).
STATISTICS PANEL
Every raw signal - including the ones the filters hide - is followed until it reaches its target or its stop. If both are touched on the same bar it counts as a loss. Results are shown as hit rate and average R per trade, split by regime, higher timeframe alignment and divergence.
The "Statistics start date" setting counts signals from a chosen date in a separate set. Set it to the day you stop changing settings: that set is then data your settings were never tuned on.
How to read it: R is the main measure. A split is worth trusting only with at least 40 samples per group, a clear R difference, and the same difference on another symbol. Results differ a lot between markets and timeframes - in testing, a filter that helped on one market did nothing or the opposite on another. Check the panel on your own chart before relying on any signal.
NOTES
- Signals are confirmed on bar close by default and do not disappear afterwards.
- Works on the free plan (one request.security call).
- Settings are in English; the panel can be switched to Turkish.
- This is an analysis and measurement tool. Past statistics do not guarantee future results, and nothing here is financial advice.
CREDITS
- Range filter formula: the open-source "Range Filter" by guikroth / DonovanWall, re-implemented.
- RSI-to-price inversion: Giorgos Siligardos, "Reverse Engineering RSI" (TASC, 2003).
- Inspired by Adaptive Range Filter (MarkitTick) and RSI Master (SimpleAlgo). No code from either was used.
──────────────────────────────────────────────
TURKCE
──────────────────────────────────────────────
RRF; trend yonu icin range filter, fiyata cevrilmis dinamik RSI bantlari ve bu bantlarda tepe/dip arayan bir donus motorunu tek grafikte birlestirir. Asil ozelligi istatistik panelidir: bastigi her sinyali olcer ve hangi sinyalin senin sembolunde ve periyodunda gercekten calistigini gosterir.
▼ Tepe / ▲ Dip: banda temas + ret mumu. ◆ = RSI uyumsuzlugu. ★ = uyumsuzluk + ust zaman dilimi uyumu.
Panelde asil olcu R'dir. Bir sonuca guvenmek icin her grupta en az 40 ornek, belirgin R farki ve ayni farkin baska bir sembolde de cikmasi gerekir.
Bu bir analiz ve olcum aracidir; yatirim tavsiyesi degildir.
Release Notes
v1.3.1- Every setting now has a tooltip: hover the ⓘ icon to see what it does, what changes when you raise or lower it, and any warnings. Tooltips are in Turkish with a short English line.
- Header comments cleaned up. No change to signals, statistics or default settings.
v1.3.1
- Tüm ayarlara açıklama eklendi: ⓘ simgesinin üzerine gelince ayarın ne yaptığı, değeri büyütüp küçültünce neyin değiştiği ve varsa uyarılar görünür.
- Başlık açıklamaları düzenlendi. Sinyaller, istatistikler ve varsayılan ayarlar değişmedi.

Disclaimer
The information and publications are not meant to be, and do not constitute, financial, investment, trading, or other types of advice or recommendations supplied or endorsed by TradingView. Read more in the Terms of Use.
Disclaimer
The information and publications are not meant to be, and do not constitute, financial, investment, trading, or other types of advice or recommendations supplied or endorsed by TradingView. Read more in the Terms of Use.