OPEN-SOURCE SCRIPT
Updated Adaptive Consensus Trail Structure, Regime & Self
Adaptive Consensus Trail — Structure, Regime & Self-Test
A trailing stop that sits on the agreement of several structural references, adapts to the market regime, and forward-tests its own signals so the numbers it shows are measured, not asserted.
What it is
Most trailing stops follow one idea — an ATR band, a SuperTrend, a moving average. This one places the stop where a small committee of independent structural references agree, reads how confident that agreement is, widens or tightens itself according to the market regime, and then continuously audits its own flips and reports the edge it actually produced on your data.
The committee has five members, each locating support/resistance from a different lens:
Anchored VWAP band — fair value for the session/week/month
Session / naked volume Point-of-Control — the price the most volume traded at, carried forward until revisited
Fair-Value-Gap midpoint — unfilled imbalance
Swing pivot — structural memory
Order-flow absorption — where aggressive buying/selling was absorbed (via Bulk Volume Classification)
Why these parts belong in one script (mashup justification)
Each reference alone whipsaws on an index, and each is right in different conditions. They are combined because they correct one another, and the entire value of the script is in that interaction — not in any single line:
A reliability layer scores every reference's historical respect rate with a Wilson lower bound, so a reference that keeps getting ignored loses its vote instead of dragging the stop around.
A consensus layer keeps only the densest agreeing cluster of references, so the stop sits on genuine agreement rather than on an average nobody respects, and far-apart references never force a permanent "no signal."
A regime layer (efficiency ratio + ADX + band-width + a volatility-cluster read + a Hurst persistence estimate) widens the band and tightens the flip confirmation in chop — this is what removes the whipsaw.
A self-test layer forward-scores every flip and recalibrates the confidence number so it means what it says.
Split apart, these are five overlays that each mislead in a range. Wired together, they are one self-correcting, self-auditing trail. That is the reason for combining them.
How it works (six layers)
References are computed on the bar close.
Reliability — rolling-capped respect counts per reference give a Wilson lower-bound "trust." POC is a magnet, so it is judged by forward reaction (did price reject away before breaking through?), not a same-bar close, which keeps its trust honest.
Consensus — the densest agreeing cluster within an ATR band becomes the trail's target; the envelope and confidence are measured on that cluster only.
Adaptive backbone — an efficiency-ratio / regime-adaptive band (Adaptive, Chandelier, or Blend) that widens in chop.
The trail — high confidence pulls the stop toward structure (floored a minimum ATR off price); low confidence rides the wide band, so it flips less in noise.
Self-test — every flip is forward-resolved by triple-barrier first-touch against an unconditional base rate, split by strength tier and by regime, with a walk-forward in-sample→out-of-sample check, a runs test of independence, a Brier score, and a confidence recalibration.
How to use it
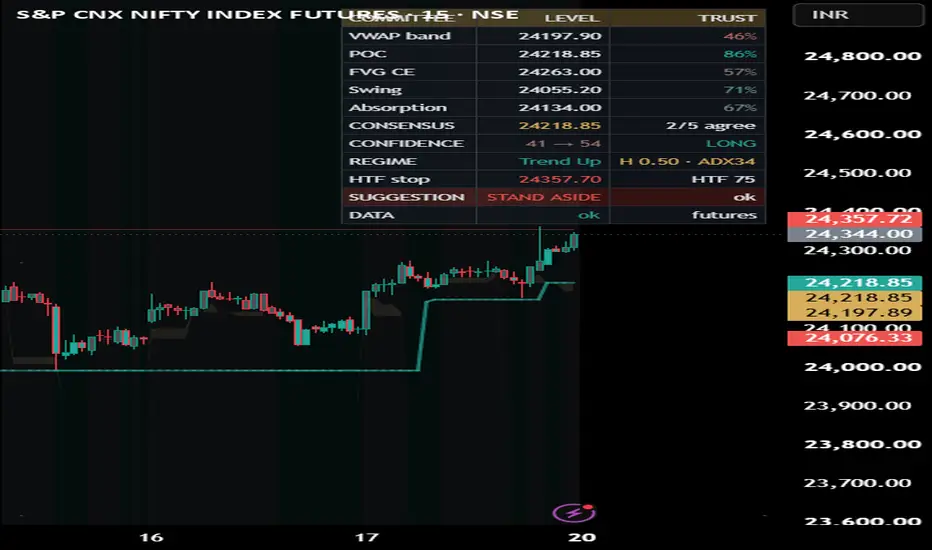
Read the top banner for the one-line bias — BULLISH / BEARISH / WAIT — and the READ legend for what to do. The coloured line is your stop: support in an uptrend, resistance in a downtrend. BUY / SELL labels print only on confirmed, sufficiently-confident, higher-timeframe-aligned flips.
The dashboard gives detail top-down: each reference's level and trust, the consensus, raw → calibrated confidence, regime (with Hurst and ADX), the higher-timeframe invalidation stop, and a FULL / HALF / STAND-ASIDE suggestion.
Before sizing, open the Self-Test panel and read the Edge column (hit% − base%), not the raw hit-rate. A ★ means the edge's confidence interval clears the base rate. Prefer signals where the walk-forward change isn't badly negative and the runs test isn't "streaky." Being honest about it: on many indices this tool shows real edge in range and volatile regimes on higher timeframes and little-to-none on very low timeframes or once a trend is already confirmed — the panel makes that transparent so you can pick your spots.
Works on any market
Set the Price source, and for symbols with no native volume set a Borrow-volume proxy (e.g. a futures contract). The panel theme adapts to your chart background automatically. Backbone: Adaptive / Chandelier / Blend. Absorption: order-flow (BVC) or simple. An optional intrabar resolution builds a finer volume profile where available.
Originality
The committee-of-references design, the cluster-not-average consensus, the reliability weighting that lets references lose their vote, the forward-reaction POC respect test, and the confidence self-calibration are the author's own work. The underlying techniques are standard and fully credited below.
Non-repaint
References, regime, consensus and the trail all evaluate on the close of the bar; the live bar is provisional and settles on close. Self-test events are logged and resolved only on confirmed bars and resolve on bars after their trigger at fixed barriers, so hit / base / edge use no look-ahead. The higher-timeframe stop uses a lookahead-off request.
Concept credits
Wilson score interval (E. B. Wilson); efficiency ratio (P. Kaufman); ADX / DMI / ATR / volatility-stop lineage (J. W. Wilder); anchored VWAP (industry standard); volume profile / value area / point-of-control — Market Profile (J. P. Steidlmayer, developed by J. F. Dalton); triple-barrier first-touch labelling (M. López de Prado); runs test of randomness (A. Wald & J. Wolfowitz); rescaled-range / Hurst exponent (H. E. Hurst); Brier score (G. W. Brier); Bulk Volume Classification / VPIN (D. Easley, M. López de Prado & M. O'Hara); reliability-bin (isotonic-style) calibration is standard forecasting practice.
Limitations & disclaimer
"Absorption" is a volume proxy — base data has no true tick order flow, so the buy/sell split is estimated from bar moves, not measured. Confidence is context, not a promise of profit. The self-test is descriptive of past behaviour on the loaded symbol (fixed barriers, no costs or slippage) — a study aid, not a backtest and not a guarantee. A measured edge is what flips did historically here, not a forecast.
This script is for research and education only. It is not financial advice, not a recommendation to buy or sell, and not a guarantee of any outcome. Trading carries risk of loss; your decisions are your own. Test on your own data and use independent risk management before relying on it.
A trailing stop that sits on the agreement of several structural references, adapts to the market regime, and forward-tests its own signals so the numbers it shows are measured, not asserted.
What it is
Most trailing stops follow one idea — an ATR band, a SuperTrend, a moving average. This one places the stop where a small committee of independent structural references agree, reads how confident that agreement is, widens or tightens itself according to the market regime, and then continuously audits its own flips and reports the edge it actually produced on your data.
The committee has five members, each locating support/resistance from a different lens:
Anchored VWAP band — fair value for the session/week/month
Session / naked volume Point-of-Control — the price the most volume traded at, carried forward until revisited
Fair-Value-Gap midpoint — unfilled imbalance
Swing pivot — structural memory
Order-flow absorption — where aggressive buying/selling was absorbed (via Bulk Volume Classification)
Why these parts belong in one script (mashup justification)
Each reference alone whipsaws on an index, and each is right in different conditions. They are combined because they correct one another, and the entire value of the script is in that interaction — not in any single line:
A reliability layer scores every reference's historical respect rate with a Wilson lower bound, so a reference that keeps getting ignored loses its vote instead of dragging the stop around.
A consensus layer keeps only the densest agreeing cluster of references, so the stop sits on genuine agreement rather than on an average nobody respects, and far-apart references never force a permanent "no signal."
A regime layer (efficiency ratio + ADX + band-width + a volatility-cluster read + a Hurst persistence estimate) widens the band and tightens the flip confirmation in chop — this is what removes the whipsaw.
A self-test layer forward-scores every flip and recalibrates the confidence number so it means what it says.
Split apart, these are five overlays that each mislead in a range. Wired together, they are one self-correcting, self-auditing trail. That is the reason for combining them.
How it works (six layers)
References are computed on the bar close.
Reliability — rolling-capped respect counts per reference give a Wilson lower-bound "trust." POC is a magnet, so it is judged by forward reaction (did price reject away before breaking through?), not a same-bar close, which keeps its trust honest.
Consensus — the densest agreeing cluster within an ATR band becomes the trail's target; the envelope and confidence are measured on that cluster only.
Adaptive backbone — an efficiency-ratio / regime-adaptive band (Adaptive, Chandelier, or Blend) that widens in chop.
The trail — high confidence pulls the stop toward structure (floored a minimum ATR off price); low confidence rides the wide band, so it flips less in noise.
Self-test — every flip is forward-resolved by triple-barrier first-touch against an unconditional base rate, split by strength tier and by regime, with a walk-forward in-sample→out-of-sample check, a runs test of independence, a Brier score, and a confidence recalibration.
How to use it
Read the top banner for the one-line bias — BULLISH / BEARISH / WAIT — and the READ legend for what to do. The coloured line is your stop: support in an uptrend, resistance in a downtrend. BUY / SELL labels print only on confirmed, sufficiently-confident, higher-timeframe-aligned flips.
The dashboard gives detail top-down: each reference's level and trust, the consensus, raw → calibrated confidence, regime (with Hurst and ADX), the higher-timeframe invalidation stop, and a FULL / HALF / STAND-ASIDE suggestion.
Before sizing, open the Self-Test panel and read the Edge column (hit% − base%), not the raw hit-rate. A ★ means the edge's confidence interval clears the base rate. Prefer signals where the walk-forward change isn't badly negative and the runs test isn't "streaky." Being honest about it: on many indices this tool shows real edge in range and volatile regimes on higher timeframes and little-to-none on very low timeframes or once a trend is already confirmed — the panel makes that transparent so you can pick your spots.
Works on any market
Set the Price source, and for symbols with no native volume set a Borrow-volume proxy (e.g. a futures contract). The panel theme adapts to your chart background automatically. Backbone: Adaptive / Chandelier / Blend. Absorption: order-flow (BVC) or simple. An optional intrabar resolution builds a finer volume profile where available.
Originality
The committee-of-references design, the cluster-not-average consensus, the reliability weighting that lets references lose their vote, the forward-reaction POC respect test, and the confidence self-calibration are the author's own work. The underlying techniques are standard and fully credited below.
Non-repaint
References, regime, consensus and the trail all evaluate on the close of the bar; the live bar is provisional and settles on close. Self-test events are logged and resolved only on confirmed bars and resolve on bars after their trigger at fixed barriers, so hit / base / edge use no look-ahead. The higher-timeframe stop uses a lookahead-off request.
Concept credits
Wilson score interval (E. B. Wilson); efficiency ratio (P. Kaufman); ADX / DMI / ATR / volatility-stop lineage (J. W. Wilder); anchored VWAP (industry standard); volume profile / value area / point-of-control — Market Profile (J. P. Steidlmayer, developed by J. F. Dalton); triple-barrier first-touch labelling (M. López de Prado); runs test of randomness (A. Wald & J. Wolfowitz); rescaled-range / Hurst exponent (H. E. Hurst); Brier score (G. W. Brier); Bulk Volume Classification / VPIN (D. Easley, M. López de Prado & M. O'Hara); reliability-bin (isotonic-style) calibration is standard forecasting practice.
Limitations & disclaimer
"Absorption" is a volume proxy — base data has no true tick order flow, so the buy/sell split is estimated from bar moves, not measured. Confidence is context, not a promise of profit. The self-test is descriptive of past behaviour on the loaded symbol (fixed barriers, no costs or slippage) — a study aid, not a backtest and not a guarantee. A measured edge is what flips did historically here, not a forecast.
This script is for research and education only. It is not financial advice, not a recommendation to buy or sell, and not a guarantee of any outcome. Trading carries risk of loss; your decisions are your own. Test on your own data and use independent risk management before relying on it.
Release Notes
Minor UpdateRelease Notes
v1.1 — Correctness + cost model + finishing pass- Correctness: a bandwidth-ratio average (ta.sma) was computed twice — once inside a conditional
branch — which Pine can flag as inconsistent (CW10004). It now runs once per bar, unconditionally.
Output is unchanged; the warning and the redundant work are gone.
- Added a cost model to the self-test: a new "Round-trip cost (R)" input and a Net R row (gross
R-expectancy of the trail's flips, minus cost). Net R > 0 = the flip edge is tradeable after costs.
This is a past-only, descriptive read; it does not change when the trail flips.
- Added a Data Window (EXP_) export bus so the trail, direction, confidence, edge and the gross/net
expectancy (EXP_ExpR / EXP_NetR) can feed other scripts via input.source().
- Added the MPL-2.0 licence header.
- No change to the consensus engine, the trailing stop or the self-test statistics — everyday
behaviour is identical.
Descriptive research tooling, past-only self-test, not investment advice.
Open-source script
In true TradingView spirit, the creator of this script has made it open-source, so that traders can review and verify its functionality. Kudos to the author! While you can use it for free, remember that republishing the code is subject to our House Rules.

Disclaimer
The information and publications are not meant to be, and do not constitute, financial, investment, trading, or other types of advice or recommendations supplied or endorsed by TradingView. Read more in the Terms of Use.
Open-source script
In true TradingView spirit, the creator of this script has made it open-source, so that traders can review and verify its functionality. Kudos to the author! While you can use it for free, remember that republishing the code is subject to our House Rules.
Disclaimer
The information and publications are not meant to be, and do not constitute, financial, investment, trading, or other types of advice or recommendations supplied or endorsed by TradingView. Read more in the Terms of Use.