Adaptive Flow Pressure Oscillator (AFPO) [QuantAlgo]
🟢 Overview
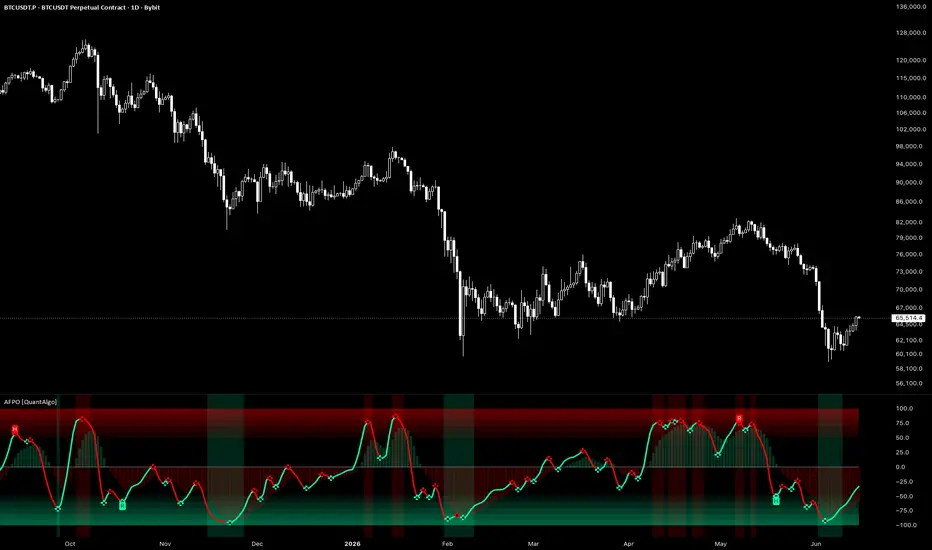
The Adaptive Flow Pressure Oscillator (AFPO) employs an effort-versus-result detection architecture to reveal the directional pressure building beneath price, distinguishing moves that are genuinely supported from those running on thin participation. Unlike conventional volume oscillators that measure which way volume is flowing, AFPO measures how much price movement each unit of participation actually buys, exposing absorption and exhaustion that flow-direction methods tend to miss. This effort-versus-result framing means a large volume burst that fails to move price reads very differently from a small burst that travels far, so the oscillator surfaces the moment pressure starts being absorbed rather than waiting for price to confirm the turn.

🟢 How It Works
The indicator builds its core logic around the relationship between effort and result on every bar. Effort is current volume normalised against its own recent baseline, so participation is judged relative to what is normal for the instrument rather than as a raw figure. Result is price displacement normalised against recent volatility, so the same move means more in a quiet tape than in a violent one. Multiplying a volatility-aware result by a dampened measure of effort produces a directional pressure reading that rises when participation is efficiently moving price and fades when heavy participation is being absorbed without progress.
The raw reading is then scaled against its own rolling volatility rather than hard compressed, so a genuine extreme keeps travelling proportionally instead of saturating into a flat line, preserving the resolution needed to read pressure building into a reversal. A separate display layer eases the strongest readings into the overbought and oversold zones so the line presses into the extreme the way a clean reversion oscillator should, while every signal, alert and divergence is computed on the true uncompressed value. On symbols without volume data the effort term falls back to neutral so the oscillator degrades to a pure price-displacement reading and still plots, with a note marking when that mode is active.

🟢 How to Use It
▶ Overbought Pressure (Upper Zone): The line has pressed into the overbought extreme on strong directional pressure. This is the environment to be watching for downside mean reversion, fading the move as the line eases toward its ceiling rather than chasing it, with the zone shading marking how stretched the reading has become.
▶ Oversold Pressure (Lower Zone): The line has driven into the oversold extreme, marking pressure that may be reaching exhaustion to the downside. This favours watching for upside reversion, with the line acting as a gauge of how much further the move can realistically extend before participation runs dry.
▶ Trend Bias (Histogram): The faded histogram behind the line is the slower smoothed bias and reads as a directional reference rather than a reversion cue. Staying with the side the bias sits on, above zero for long bias and below zero for short, and treating the line crossing the bias as a continuation cue, lets trend followers use the same tool the opposite way to reversion traders. For mean reversion traders it serves as a reminder of which regime they are in, so they are not constantly standing in the way of a developing trend, and can be more cautious about fading a move when the bias is pushing hard in the same direction.

🟢 Features
▶ Built-in Alerts: A full set of alert conditions support automated monitoring without constant chart observation, organised by trading style. Mean reversion alerts cover overbought and oversold pressure breaches along with regular and hidden divergences between price and the line. Trend alerts cover zero-line crosses, which mark a flip in net pressure direction, and crosses of the line through its bias histogram, which flag trend continuation. Momentum pivot alerts fire whenever the reading flips direction, giving an early heads-up for either style.

▶ Visual Customisation: Six colour presets (Classic, Aqua, Cosmic, Cyber, Neon, plus Custom) accommodate different chart themes and personal preferences, with coordinated bullish and bearish schemes applied consistently across every element of the oscillator: the signal line, the bias histogram, the graded overbought and oversold zones, the extreme background tint, and the pivot and divergence markers. The adjustable overbought and oversold bounds let you control how compressed the extremes appear, opening the zones up for more room to anticipate a reversal or tightening them for a more contained read. An extreme background tint reinforces the prevailing pressure state across the panel, and adjustable divergence filtering lets you trade sensitivity for cleaner, higher-conviction divergence signals.

🟢 Pro Tips for Trading and Investing
▶ Market context matters significantly for any pressure-based system. AFPO performs best where real participation exists to measure, since the effort-versus-result relationship is only meaningful when volume is genuine, and it is at its sharpest reading absorption and exhaustion at the extremes of a trending or rotating market. Before acting on an extreme reading, assess the broader structure on a higher timeframe: a reversion signal carries far more weight when it forms at a major support or resistance level than when it appears in open space. On volumeless symbols, remember the oscillator is reading price displacement alone, so treat its extremes as a momentum gauge rather than a true effort-versus-result signal.
▶ Layer AFPO with complementary analysis rather than treating it as a standalone decision tool. It pairs especially well with the Fourier Smoothed Volume Zone Oscillator (FSVZO) Forecast indicator from our QuantAlgo toolkit: where AFPO reads the efficiency of participation and tends to surface absorption and reversion a touch earlier, FSVZO reads the direction of volume flow and offers a complementary confirmation of who is in control, so a reversion signal that both tools agree on carries more weight than either alone. Combine pressure extremes with key structural levels and broader volume context, since an extreme forming on expanding participation near major support or resistance is far stronger than one in open space. Pairing this script with trend, breadth, or volatility tools from the QuantAlgo suite can further validate directional bias before committing capital.
The Adaptive Flow Pressure Oscillator (AFPO) employs an effort-versus-result detection architecture to reveal the directional pressure building beneath price, distinguishing moves that are genuinely supported from those running on thin participation. Unlike conventional volume oscillators that measure which way volume is flowing, AFPO measures how much price movement each unit of participation actually buys, exposing absorption and exhaustion that flow-direction methods tend to miss. This effort-versus-result framing means a large volume burst that fails to move price reads very differently from a small burst that travels far, so the oscillator surfaces the moment pressure starts being absorbed rather than waiting for price to confirm the turn.
🟢 How It Works
The indicator builds its core logic around the relationship between effort and result on every bar. Effort is current volume normalised against its own recent baseline, so participation is judged relative to what is normal for the instrument rather than as a raw figure. Result is price displacement normalised against recent volatility, so the same move means more in a quiet tape than in a violent one. Multiplying a volatility-aware result by a dampened measure of effort produces a directional pressure reading that rises when participation is efficiently moving price and fades when heavy participation is being absorbed without progress.
The raw reading is then scaled against its own rolling volatility rather than hard compressed, so a genuine extreme keeps travelling proportionally instead of saturating into a flat line, preserving the resolution needed to read pressure building into a reversal. A separate display layer eases the strongest readings into the overbought and oversold zones so the line presses into the extreme the way a clean reversion oscillator should, while every signal, alert and divergence is computed on the true uncompressed value. On symbols without volume data the effort term falls back to neutral so the oscillator degrades to a pure price-displacement reading and still plots, with a note marking when that mode is active.
🟢 How to Use It
▶ Overbought Pressure (Upper Zone): The line has pressed into the overbought extreme on strong directional pressure. This is the environment to be watching for downside mean reversion, fading the move as the line eases toward its ceiling rather than chasing it, with the zone shading marking how stretched the reading has become.
▶ Oversold Pressure (Lower Zone): The line has driven into the oversold extreme, marking pressure that may be reaching exhaustion to the downside. This favours watching for upside reversion, with the line acting as a gauge of how much further the move can realistically extend before participation runs dry.
▶ Trend Bias (Histogram): The faded histogram behind the line is the slower smoothed bias and reads as a directional reference rather than a reversion cue. Staying with the side the bias sits on, above zero for long bias and below zero for short, and treating the line crossing the bias as a continuation cue, lets trend followers use the same tool the opposite way to reversion traders. For mean reversion traders it serves as a reminder of which regime they are in, so they are not constantly standing in the way of a developing trend, and can be more cautious about fading a move when the bias is pushing hard in the same direction.
🟢 Features
▶ Built-in Alerts: A full set of alert conditions support automated monitoring without constant chart observation, organised by trading style. Mean reversion alerts cover overbought and oversold pressure breaches along with regular and hidden divergences between price and the line. Trend alerts cover zero-line crosses, which mark a flip in net pressure direction, and crosses of the line through its bias histogram, which flag trend continuation. Momentum pivot alerts fire whenever the reading flips direction, giving an early heads-up for either style.
▶ Visual Customisation: Six colour presets (Classic, Aqua, Cosmic, Cyber, Neon, plus Custom) accommodate different chart themes and personal preferences, with coordinated bullish and bearish schemes applied consistently across every element of the oscillator: the signal line, the bias histogram, the graded overbought and oversold zones, the extreme background tint, and the pivot and divergence markers. The adjustable overbought and oversold bounds let you control how compressed the extremes appear, opening the zones up for more room to anticipate a reversal or tightening them for a more contained read. An extreme background tint reinforces the prevailing pressure state across the panel, and adjustable divergence filtering lets you trade sensitivity for cleaner, higher-conviction divergence signals.
🟢 Pro Tips for Trading and Investing
▶ Market context matters significantly for any pressure-based system. AFPO performs best where real participation exists to measure, since the effort-versus-result relationship is only meaningful when volume is genuine, and it is at its sharpest reading absorption and exhaustion at the extremes of a trending or rotating market. Before acting on an extreme reading, assess the broader structure on a higher timeframe: a reversion signal carries far more weight when it forms at a major support or resistance level than when it appears in open space. On volumeless symbols, remember the oscillator is reading price displacement alone, so treat its extremes as a momentum gauge rather than a true effort-versus-result signal.
▶ Layer AFPO with complementary analysis rather than treating it as a standalone decision tool. It pairs especially well with the Fourier Smoothed Volume Zone Oscillator (FSVZO) Forecast indicator from our QuantAlgo toolkit: where AFPO reads the efficiency of participation and tends to surface absorption and reversion a touch earlier, FSVZO reads the direction of volume flow and offers a complementary confirmation of who is in control, so a reversion signal that both tools agree on carries more weight than either alone. Combine pressure extremes with key structural levels and broader volume context, since an extreme forming on expanding participation near major support or resistance is far stronger than one in open space. Pairing this script with trend, breadth, or volatility tools from the QuantAlgo suite can further validate directional bias before committing capital.
Available in Paid Space
This indicator is only available to QuantAlgo Essential subscribers. Join to access this and other scripts by QuantAlgo.

🟢 Access our best trading & investing tools: joinquantalgo.com/plans
🟢 Free Special Edition indicators: joinquantalgo.com/special-editions
🟢 Discord: discord.gg/hJaFyGEAyX
🟢 Free Special Edition indicators: joinquantalgo.com/special-editions
🟢 Discord: discord.gg/hJaFyGEAyX
Disclaimer
The information and publications are not meant to be, and do not constitute, financial, investment, trading, or other types of advice or recommendations supplied or endorsed by TradingView. Read more in the Terms of Use.
Available in Paid Space
This indicator is only available to QuantAlgo Essential subscribers. Join to access this and other scripts by QuantAlgo.
🟢 Access our best trading & investing tools: joinquantalgo.com/plans
🟢 Free Special Edition indicators: joinquantalgo.com/special-editions
🟢 Discord: discord.gg/hJaFyGEAyX
🟢 Free Special Edition indicators: joinquantalgo.com/special-editions
🟢 Discord: discord.gg/hJaFyGEAyX
Disclaimer
The information and publications are not meant to be, and do not constitute, financial, investment, trading, or other types of advice or recommendations supplied or endorsed by TradingView. Read more in the Terms of Use.