Updated
Tiki Gamma (GEX)
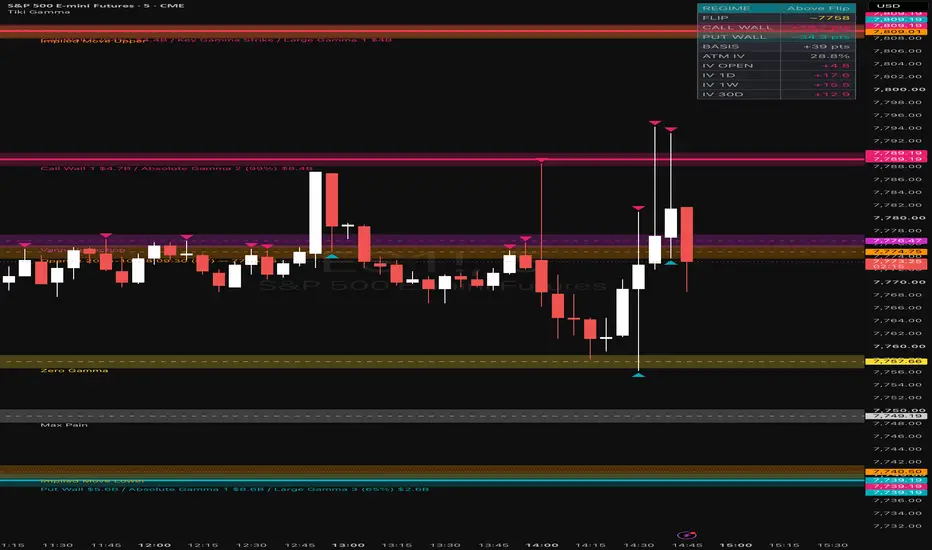
Tiki Gamma maps the options dealer hedging levels that may influence intraday price action — directly on your chart.
Options dealers hedge trillions in exposure every session. They typically hedge by buying or selling the underlying to stay delta-neutral. Theoretical models suggest that at strikes where large open interest concentrates, this hedging may be large enough to influence price. These flows can be systematic and large, and are often watched by institutional desks as potential structural support and resistance reference points.
This indicator draws manually provided levels. It does not calculate levels from live options data. It is a visualization tool for external data.
What It Draws
Call Walls & Put Walls — Overhead zones where theoretical dealer selling is heaviest. Below-market zones where theoretical dealer buying provides structural support. Call walls may resist upward moves; put walls, if broken, may lead to accelerated moves. Line thickness scales with strength so the dominant level is immediately visible.
Zero Gamma Flip — An important regime filter in modern markets. Above it, dealers may trade mean-reverting. Below it, they may trade amplifying.
Expert Configuration (Signal-to-Noise Ratio) — Ships with optimized configuration for high-conviction trading. We recommend limiting Walls and Absolute Gamma to 3 levels each at 80%+ strength to filter out noise, while keeping Large Gamma at a 5-level, 50% strength threshold to catch secondary intraday pivots.
Gamma Transition Band (Experimental) — The contested zone around the flip where dealer positioning is mixed. Price action inside this band is inherently noisier. These levels are currently in experimental beta.
Key Gamma Strike & Large Gamma — Potential areas of interest. Price may gravitate toward them. In trending sessions, they can act as checkpoint S/R. Optional strength percentages and GEX magnitude labels show which levels carry real weight.
Vanna Inflection — Where an IV expansion triggers forced delta rehedging independent of price movement. A level that is often monitored during gap opens and VIX events.
Speed Trap — Where a move lower may theoretically create disproportionate dealer selling. A level that may turn a pullback into a flush.
Max Pain — The settlement gravity point. The zone expands automatically near close as charm-driven delta unwinding theoretically strengthens into expiration — reflecting end-of-day pinning behavior.
Expected / Implied Move Bands — 1-SD and 2-SD statistical envelopes. Inside the box: mean reversion is plausible. Outside it: respect the move.
Visual Design
- Regime Background — Chart can be configured to tint teal above the gamma flip (stabilizing), magenta below (amplifying). Off by default to minimize clutter.
- Strength-Scaled Lines & Opacity — Dominant levels draw thicker and more opaque. Weaker levels fade. Hierarchy is visible without reading a single label.
- HUD Dashboard — Compact overlay showing current regime, distance to nearest walls in implied-move units (sigma), and futures basis shift.
- Proximity Highlighting — Zone opacity increases when price enters a level. The active level always stands out.
- Max Pain Expansion — The max pain zone grows as charm effects strengthen into the close, reflecting real-time gravitational pull.
- Price Axis Tags — Every level is tagged on the price axis for quick reference without chart clutter.
- Futures Basis Shift — SPX/NDX levels mapped accurately onto ES/NQ charts. When in Prior Bar mode, the indicator dynamically calculates the exact, real-time basis offset using prior close data to ensure perfect, stable alignment. If the ticker is unmapped or Session Open mode is selected, it automatically falls back to your initially pasted Basis Shift.
Settings & Configuration
The indicator features deep customisation via its settings panel, grouped for ease of use:
- Visibility — Toggle individual level types (Walls, GEX nodes, Vanna, Speed Trap, etc.), the HUD Dashboard, and Price Axis Labels. Choose between Level names, Prices, or both for on-chart labels.
- Style — Adjust base Line Width and enable Strength scaling for width/opacity. Toggle GEX Magnitude ($) and Vol Resilience (↑/↓) arrows in labels. Select Label Alignment (Left vs Last Bar) and Format (Full vs Abbreviated). Configure Display Timezone for timestamped levels.
- Level Filters — Fine-tune signal clarity by setting global and per-type "Min Strength %" thresholds. Use the "Max Total Levels" cap to limit the total number of lines drawn near price.
- Colors & Opacity — Customise the color for every level category. Global sliders control base opacity for lines and shaded influence zones.
- Visual Effects & Advanced — Configure Regime Background colors and opacity. Customise Advanced Max Pain settings, including the close-time target and the growth window for end-of-day expansion.
How It Works
Paste your formatted level data into the indicator's text input. Each level accepts optional metadata — strength, vol resilience, and GEX magnitude — so the indicator reflects the full depth of the pipeline output, not just price levels.
Open Source
Full source is published openly. Read it, fork it, learn from it. Every level type is documented in the script header with the theoretical dealer mechanics that drive it. The display layer is transparent.
Release Notes
This update puts alerts at the center of the workflow, so you can act on level interactions without staring at the chart. A single alert on “Any alert() function call” now covers every armed level event, with flexible JSON, Human, or Custom output and useful tokens for action, event, level, price, strength, and more—making it easy to route precise signals into your existing tools, bots, or notifications. Combined with clear ▲/▼ chart markers that highlight when price pierces an armed level, you get both immediate visual confirmation and reliable, customizable alerts that fire only after the bar closes.The rest of the release keeps the context clean and decision-ready: ATM IV (plus short-term IV readings) appears directly on the HUD and color-codes rising versus falling volatility, while labels, line widths, and Flip/Basis values are refined so the most important levels stay easy to read at a glance. Together these changes help you stay focused on high-conviction setups and respond faster when price tests the levels that matter.
**Signals and alerts**
- Clear ▲ and ▼ markers appear when price interacts with an armed level, so you can instantly see which levels are being tested without digging through the chart.
- Markers sit as chart labels, keeping your price-axis tags clean and unobstructed.
- Arm Scope defaults to All visible levels. Switch to Custom to focus on the categories that matter most to you, or Nearest only to track just the call wall above and put wall below.
- Confirm on Bar Close is enabled by default, so signals wait for the bar to finish and avoid false triggers from incomplete candles.
- Signal markers start at a compact size so they draw attention without cluttering the chart.
- Create one alert on “Any alert() function call” to cover every armed level event. Choose JSON, Human, or Custom format, and use tokens such as {action}, {event}, {level}, {level_price}, {price}, {ticker}, {interval}, {strength}, and {basis_shift} to route exactly the information you need. Recreate the alert after changing Arm Scope so it stays in sync.
**ATM IV on the HUD**
- When ATM IV is included in your paste, the HUD shows ATM IV along with IV 1D, IV 1W, and IV 30D, giving you volatility context right next to the levels.
- IV Open appears only when the paste contains a real open print, so you only see values that are actually available.
- Rising IV is colored with the resistance color and falling IV uses the support color, making shifts in volatility easy to read at a glance.
- Show ATM IV is on by default. Show IV Symbol and Show IV DTE are off, so the row stays focused on the volatility number until you choose to expand it.
- Paste format example: ATM IV: NDX 1DTE 18.4
**Chart**
- When Strength → Line Width is off, every level draws at the Default Line Width for a clean, consistent look. Min and Max Line Width only apply when strength-based scaling is turned on.
- Strength % in Labels is a new toggle (on by default), so you can quickly see how strong each level is without extra steps.
- With Level Zones enabled, labels sit on the outer edge of each zone for better readability. Max Pain uses its expanded zone so the label stays clear of the area.
**HUD**
- Flip now displays as a whole number. A confirmed flip is prefixed with ~ and a flip candidate ends with ?, so you can tell the status at a glance.
- Basis shows as a whole number of points for simpler, faster reading.

Disclaimer
The information and publications are not meant to be, and do not constitute, financial, investment, trading, or other types of advice or recommendations supplied or endorsed by TradingView. Read more in the Terms of Use.
Disclaimer
The information and publications are not meant to be, and do not constitute, financial, investment, trading, or other types of advice or recommendations supplied or endorsed by TradingView. Read more in the Terms of Use.