Anchored Orderflow VWAP Signals [AlgoAlpha]
More exclusive indicators from AlgoAlpha
Subscribe to Unfair Advantage Pack for $65.57/month to get exclusive indicators by this author. You pay right on TradingView and can use them on your charts straight away.
Explore Unfair Advantage Pack🟠 OVERVIEW
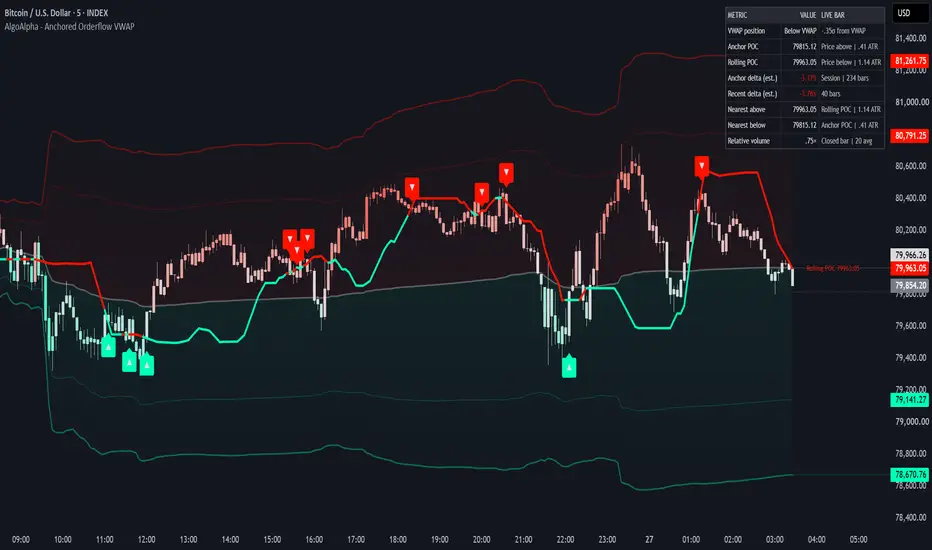
Anchored Orderflow VWAP Levels combines volume-weighted average price (VWAP), deviation bands, volume distribution, and estimated buying and selling pressure into one chart. It shows where price trades relative to its volume-weighted average and where trading volume is concentrated.
The indicator uses a selectable anchor period to reset VWAP, its deviation bands, and the volume profile. It also tracks a separate rolling Point of Control (POC) to identify changes in recent high-volume price levels.
By combining these references, traders can assess price extension, volume concentration, and potential mean-reversion setups without switching between separate indicators.
🟠 CONCEPTS
🟠 FEATURES
🟠 HOW TO USE
🟠 CONCLUSION
Anchored Orderflow VWAP Levels [AlgoAlpha] combines anchored VWAP, volume-weighted deviation bands, volume profiles, estimated delta, and rolling POC signals. It gives traders a way to evaluate price location, volume concentration, directional pressure, and potential mean-reversion opportunities within a single chart.
Anchored Orderflow VWAP Levels combines volume-weighted average price (VWAP), deviation bands, volume distribution, and estimated buying and selling pressure into one chart. It shows where price trades relative to its volume-weighted average and where trading volume is concentrated.
The indicator uses a selectable anchor period to reset VWAP, its deviation bands, and the volume profile. It also tracks a separate rolling Point of Control (POC) to identify changes in recent high-volume price levels.
By combining these references, traders can assess price extension, volume concentration, and potential mean-reversion setups without switching between separate indicators.
🟠 CONCEPTS
- Anchored VWAP — The volume-weighted average price calculated from the selected anchor period. Each price observation receives a weight based on its trading volume. The calculation restarts at the beginning of each new session, week, month, quarter, or year.
- Volume-Weighted Deviation — A measure of how far prices vary from anchored VWAP, with greater weight given to higher-volume observations. The indicator uses this deviation to calculate two upper and two lower bands around VWAP.
- Volume Profile — A distribution of traded volume across price levels within the current anchor period. Each candle's volume is assigned to its closing price, allowing the profile to identify areas with greater or lower volume concentration.
- Point of Control (POC) — The price row containing the highest accumulated volume. The Anchor POC uses the current anchored profile within the outer deviation bands, while the Rolling POC uses the latest 40 candles with smoothing over 6 bars.
- Estimated Volume Delta — The difference between bullish and bearish candle volume, expressed as a percentage of total volume. Candles closing below their opening price contribute bearish volume, while other candles contribute bullish volume. This estimates directional pressure rather than measuring actual bid and ask transactions.
- Mean Reversion — The tendency for price to move back toward a reference level after moving away from it. VWAP provides a volume-weighted reference, while deviation bands help measure how extended price has become.
- Relative Volume — The volume of the last completed candle divided by the average volume of the preceding selected number of candles. Values above 1 indicate higher volume than the comparison average, while values below 1 indicate lower volume.
🟠 FEATURES
- Anchored VWAP & Deviation Bands — Displays a central VWAP with two upper and two lower deviation levels. Gradient fills distinguish prices above and below VWAP and highlight movements beyond the outer bands.
- Orderflow Volume Profile — Displays volume distribution across price levels with optional bullish and bearish volume separation, estimated delta percentages, and a delta heat map. The Anchor POC identifies the highest-volume row within the profile.
- Rolling POC & Signal Labels — Plots a smoothed rolling Point of Control and displays Buy or Sell labels when price crosses this level under specific VWAP conditions. Buy signals require a crossover below VWAP, while Sell signals require a crossunder above VWAP. Signals confirm at candle close.
- VWAP Deviation Candles — Colors candles according to their distance from VWAP. Candles below VWAP transition toward the bullish color, while candles above VWAP transition toward the bearish color as their distance increases.
- Trading Dashboard — Displays price location within the VWAP bands, Anchor and Rolling POC levels, estimated volume delta, nearby reference levels, and relative volume. Level distances can be displayed in ATR, percentage, ticks, or price units.
🟠 HOW TO USE
- Select an anchor period based on your trading horizon. Use Session for intraday analysis, or Week, Month, Quarter, and Year for longer-term volume-weighted references.
- Observe price relative to VWAP. Prices above VWAP indicate trading above the current volume-weighted average, while prices below VWAP indicate trading below it.
- Use the deviation bands to assess price extension. Movements toward the outer bands indicate greater distance from VWAP, but do not guarantee a reversal.
- Examine the volume profile to identify price levels with concentrated trading activity. Compare the Anchor POC with the Rolling POC to distinguish the broader volume distribution from recent changes.
- Monitor Buy labels when price crosses above the Rolling POC while remaining below VWAP. These signals identify potential upward mean-reversion setups.
- Monitor Sell labels when price crosses below the Rolling POC while remaining above VWAP. These signals identify potential downward mean-reversion setups.
- Compare the estimated anchor delta with recent delta. A difference in their direction can indicate that recent candle-volume pressure differs from the broader anchor period.
- Use the dashboard to identify nearby VWAP, deviation band, and POC levels. Treat these as price references rather than confirmed support or resistance.
- Check relative volume when evaluating signals. Higher relative volume indicates greater participation compared with the preceding candles, but does not establish trade direction.
- Enable Buy Signal and Sell Signal alerts to receive notifications when the corresponding conditions are confirmed. Use additional price structure and risk management rules before entering a trade.
🟠 CONCLUSION
Anchored Orderflow VWAP Levels [AlgoAlpha] combines anchored VWAP, volume-weighted deviation bands, volume profiles, estimated delta, and rolling POC signals. It gives traders a way to evaluate price location, volume concentration, directional pressure, and potential mean-reversion opportunities within a single chart.

🚨Get premium: algoalpha.io
🛜Get FREE signals: discord.gg/xCmqTVRexz
💡Tutorials: youtube.com/@AlgoAlpha
🛜Get FREE signals: discord.gg/xCmqTVRexz
💡Tutorials: youtube.com/@AlgoAlpha
Disclaimer
The information and publications are not meant to be, and do not constitute, financial, investment, trading, or other types of advice or recommendations supplied or endorsed by TradingView. Read more in the Terms of Use.
🚨Get premium: algoalpha.io
🛜Get FREE signals: discord.gg/xCmqTVRexz
💡Tutorials: youtube.com/@AlgoAlpha
🛜Get FREE signals: discord.gg/xCmqTVRexz
💡Tutorials: youtube.com/@AlgoAlpha
Disclaimer
The information and publications are not meant to be, and do not constitute, financial, investment, trading, or other types of advice or recommendations supplied or endorsed by TradingView. Read more in the Terms of Use.