Three Black Crows Penanda & Statistik
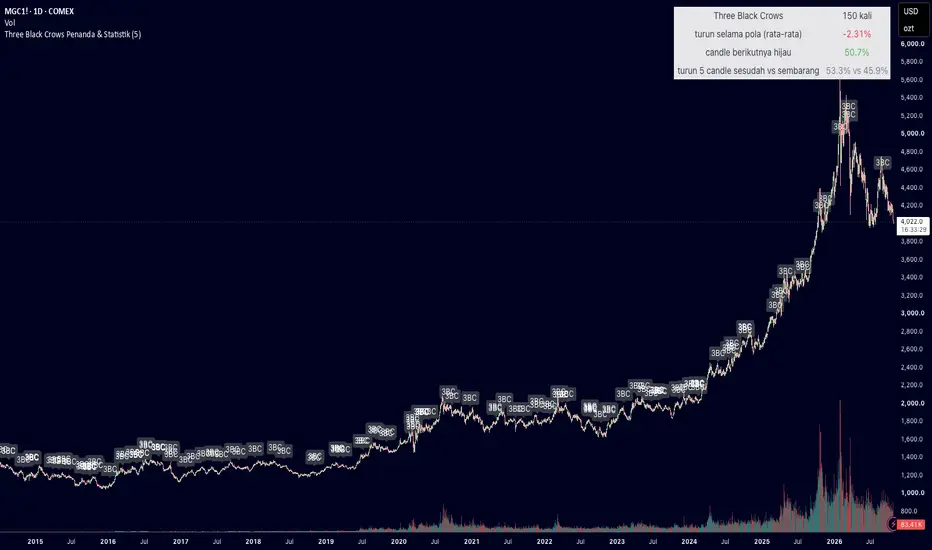
Marks Three Black Crows patterns on the chart and shows simple statistics for them, so you can see how the pattern behaved in the data you are viewing.
What it marks: three red candles in a row, each closing lower than the one before, with the candle before the first one closing above its 20-period SMA (the pattern appears after an uptrend). A "3BC" label is drawn above the bar where the pattern completes. Overlapping sequences are counted each time three red candles form.
Statistics table (top right): number of patterns found, average price drop during the pattern, share of cases where the next candle closed green, and how often price was lower N candles after entry compared with a random entry on the same chart.
How to use: add it to any chart and timeframe (daily works well) and read the table. Change "Ukur N candle sesudah masuk" in the settings to set the look-ahead window N. Results depend on the symbol, timeframe and the amount of history your plan provides.
Educational use only. This is not financial advice, and past statistics do not guarantee future results.
What it marks: three red candles in a row, each closing lower than the one before, with the candle before the first one closing above its 20-period SMA (the pattern appears after an uptrend). A "3BC" label is drawn above the bar where the pattern completes. Overlapping sequences are counted each time three red candles form.
Statistics table (top right): number of patterns found, average price drop during the pattern, share of cases where the next candle closed green, and how often price was lower N candles after entry compared with a random entry on the same chart.
How to use: add it to any chart and timeframe (daily works well) and read the table. Change "Ukur N candle sesudah masuk" in the settings to set the look-ahead window N. Results depend on the symbol, timeframe and the amount of history your plan provides.
Educational use only. This is not financial advice, and past statistics do not guarantee future results.

Disclaimer
The information and publications are not meant to be, and do not constitute, financial, investment, trading, or other types of advice or recommendations supplied or endorsed by TradingView. Read more in the Terms of Use.
Disclaimer
The information and publications are not meant to be, and do not constitute, financial, investment, trading, or other types of advice or recommendations supplied or endorsed by TradingView. Read more in the Terms of Use.