OPEN-SOURCE SCRIPT
Updated Average Entry Price and Fee-Adjusted Break-Even Workbench
Overview
Average Entry Price and Fee-Adjusted Break-Even Workbench is an open-source position cost-basis and break-even research indicator. It reconstructs a manually entered position's average entry price, weighted average cost and DCA cost basis, then calculates a cost-adjusted and fee-adjusted break-even level after configurable trading fees, spread or slippage, fixed costs and funding adjustments.
The script supports Long and Short positions, a known average price or up to eight individual fills, scale-in research and position-management scenarios.
It does not predict market direction, generate trade recommendations, read broker positions, access Trading Panel account data or place orders.
Why average entry and break-even are different
A position's average entry price is not always the price at which its estimated net result becomes zero.
Entry fees, exit fees, spread, slippage, fixed order costs and funding adjustments can move the effective break-even away from the weighted average entry.
The script separates three values that are often treated as one:
- Weighted average entry price
- Cost impact between the average entry and break-even
- Current price distance from the calculated break-even
Long and Short positions use separate equations. Percentage exit fees are solved algebraically instead of being approximated by adding a percentage directly to the average entry price.
Before a break-even result is displayed, the calculated level is reinserted into the normalized net P&L equation. The script checks the remaining residual and suppresses the result when the calculation health check does not pass.
Position input methods
The script provides two manual position-input methods.
Known average
Enter:
- Average entry price
- Remaining position quantity
- Long or Short side
This mode is suitable when the broker or another record already provides the current average entry price.
Individual fills
Enter up to eight fill prices and quantities.
The weighted average is calculated as:
Average entry price =
Sum of (fill price x fill quantity) / Sum of fill quantity
The selected number of fills determines which rows are used.
Optional dated fills can activate each fill from its specified time. When dated fills are enabled, the historical development of the weighted average can also be displayed.
Fill validation can either:
- Require all selected rows to contain valid price and quantity values
- Use only the valid rows and report how many selected fills were used
Cost-adjusted break-even
The break-even calculation can include:
- Entry fee as a percentage of entry notional
- Exit fee as a percentage of estimated exit notional
- Exit friction in ticks
- Exit friction in price units
- Fixed entry cost per order
- Fixed exit cost
- Carry or funding adjustment
- Other cash cost or credit
Exit friction can be used to represent a configurable spread or slippage assumption.
Positive fee and cash values represent costs.
Negative percentage fees, carry values or other adjustments can represent rebates or credits where applicable.
The normalized calculation concept is:
Long break-even =
Exit friction
+ (((1 + entry fee rate) x average entry price) + cash cost per unit)
/ (1 - exit fee rate)
Short break-even =
(((1 - entry fee rate) x average entry price) - cash cost per unit)
/ (1 + exit fee rate)
- exit friction
The displayed Long break-even is rounded upward to the symbol's minimum tick.
The displayed Short break-even is rounded downward to the symbol's minimum tick.
Internal calculations retain the unrounded value.
Price Only and Full Cash models
The script separates price-based calculations from cash-converted calculations.
Price Only
Percentage fees and price friction can be calculated without a point value when no fixed cash adjustments are included.
This allows the average entry, break-even, Cost Delta and current-price distance to remain available even when a reliable point value is not available.
Full Cash
Fixed cash costs, realized P&L adjustments and estimated cash P&L require a valid point value.
The script uses the symbol's point value when available. A Point Value Override can be entered when the automatic value does not match the broker, exchange or contract specification being researched.
If cash costs are entered without a valid point value, the script does not silently ignore them. It displays a Point Value Needed state instead.
Chart display
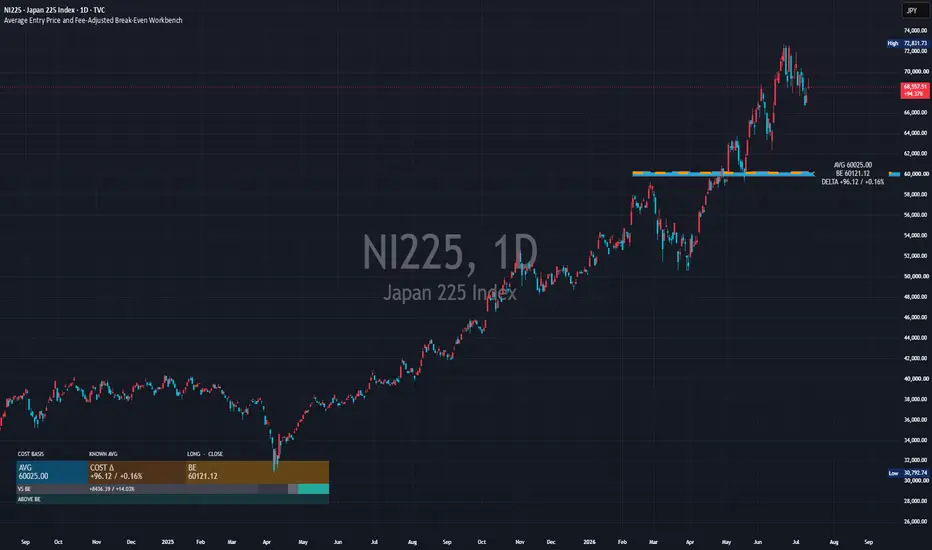
The default Overview layout provides a compact summary of:
- AVG: weighted average entry price
- COST Delta: directional difference between average entry and break-even
- BE: cost-adjusted break-even price
- VS BE: directional distance between current price and break-even
The main chart visuals use:
- A cyan solid line for the weighted average entry price
- An orange dashed line for the cost-adjusted break-even
- A shaded Cost Gap between the average and break-even
- Optional fill markers
- An optional historical weighted-average path
- A compact Position Panel
A positive VS BE value means price is on the favorable side of the calculated break-even for the selected Long or Short position.
A negative VS BE value means price is on the unfavorable side.
This is an arithmetic position-status display. It is not a trading signal.
Position Panel
The Position Panel summarizes the position without requiring the user to inspect every setting.
Depending on the selected panel mode, it can display:
- Input method
- Long or Short side
- Weighted average entry
- Cost Delta
- Cost-adjusted break-even
- Current price distance from break-even
- Price Only or Full Cash model status
- Estimated net cash P&L
- Campaign Recovery break-even
- Next Fill preview
- Target Calculation result
- Fill concentration
- Weighted fill-price dispersion
- Effective fill count
- Calculation residual
The default Bottom Left position includes transparent clearance intended to reduce overlap with TradingView's bottom-left platform mark.
The panel can be set to:
- Off
- Compact
- Overview
- Detailed
Label layout and collision handling
Label placement can be set to:
- Auto
- Split
- Combined
- Right edge
- Off
Auto mode separates the AVG and BE labels when practical.
When the two levels are visually close, Auto mode combines AVG, BE and the cost difference into one label to reduce chart congestion.
The visual-separation model uses:
- The symbol's minimum tick
- ATR
- A recent high-low range
- The configured line span
These values act as price-space proxies for how close labels may appear.
Pine Script cannot read browser zoom, display DPI or exact on-screen pixel coordinates. The collision system therefore reduces likely overlap without claiming pixel-perfect detection.
Campaign and Next Fill labels yield to the primary AVG and BE labels when their levels are too close. Their values remain available in the Detailed panel.
The Current vs BE chart note is optional and disabled by default to keep the chart clean.
Scenario research
Campaign Recovery
Campaign Recovery calculates a separate break-even using manually entered realized P&L from previous partial exits.
A positive realized P&L value reduces the remaining recovery requirement.
A negative realized P&L value increases the remaining recovery requirement.
The result is an arithmetic recovery level based on the entered values. It is not a recovery guarantee.
Next Fill
Next Fill previews:
- New total quantity
- New weighted average entry price
- New cost-adjusted break-even after a proposed additional fill
This is a scenario calculation only. It is not a recommendation to add to a position.
Target Calculation
Target Calculation determines the arithmetic quantity required to reach either:
- A target average entry price
- A target fee-adjusted break-even price
The result is checked by reinserting the calculated quantity into the target calculation.
The resulting quantity is not a recommended, optimal or safe position size.
Adding to a position increases exposure and can magnify losses.
Fill statistics
When Individual Fills is used, the Detailed panel can display:
- Largest fill share
- Weighted fill-price dispersion
- Effective fill count
These statistics help users inspect whether the cost basis is concentrated in one large fill or distributed across several fills.
Alerts
The script provides factual alert conditions for:
- Price crossing the average entry
- Price crossing the cost-adjusted break-even
- Price entering the Cost Gap
- Price exiting the Cost Gap
- Price crossing the optional Campaign Recovery break-even
- Price crossing the optional Next Fill preview break-even
Alerts are evaluated on confirmed bars.
Alert conditions require:
- A valid position
- A healthy break-even calculation
- A standard chart
- A stable calculated level
Alerts are disabled on non-standard charts.
Users must create the desired alerts separately through TradingView's alert dialog.
Realtime and historical behavior
The script does not use future data, lookahead or higher-timeframe data requests.
Live Price mode allows the Position Panel to update during an open realtime bar.
Confirmed Close mode uses the most recent confirmed close while the current realtime bar remains unfinished.
Alerts remain confirmed-bar events regardless of the selected panel price mode.
Changing an input causes the chart history to be recalculated using the new settings.
When dated fills are enabled, each fill becomes active from its manually specified time.
Non-standard charts
Heikin Ashi, Renko, Kagi, Line Break and Point & Figure prices can be synthetic.
User-entered average and break-even levels remain arithmetic levels, but the chart close may not represent an executable market price.
For this reason:
- Current-price calculations are restricted by default
- A synthetic-chart warning remains visible
- Alerts are disabled on non-standard charts
Languages
On-chart text can be selected manually in:
- English
- Japanese
- Spanish
- Portuguese (Brazil)
- German
- French
- Simplified Chinese
- Traditional Chinese
- Korean
- Turkish
- Russian
- Indonesian
English can optionally be displayed alongside the selected language.
Pine Script does not automatically read the TradingView interface language. The display language must be selected manually in the indicator settings.
Settings use stable field identifiers such as:
- P for position settings
- C for cost settings
- F for individual fills
- R for research tools
- D for display settings
- A for advanced settings
An optional localized setup guide maps the main field identifiers to the selected on-chart language.
Main interface terms
AVG = Weighted average entry price
COST Delta = Cost impact between average entry and break-even
BE = Cost-adjusted break-even price
VS BE = Current price distance from break-even
ABOVE BE = Current price is above break-even
BELOW BE = Current price is below break-even
NEAR BE = Current price is within the configured near-break-even tolerance
FULL CASH = A point value is available for cash-converted calculations
PRICE ONLY = Price calculations are available without cash conversion
POINT VALUE NEEDED = A valid point value is required for the entered cash adjustments
Basic use
1. Select Known Average or Individual Fills.
2. Select Long or Short.
3. Enter the average price and remaining quantity, or enter the selected fill prices and quantities.
4. Enter the applicable entry fee, exit fee and exit friction.
5. Enable Detailed Cash Costs only when fixed cash, funding or other cash adjustments are required.
6. Enter a Point Value Override when the automatic symbol value does not match the relevant contract specification.
7. Select the preferred layout, panel position, language, contrast and label configuration.
8. Create any required confirmed-bar alerts through TradingView's alert dialog.
Limitations
- All position information is entered manually.
- The script does not read an actual broker position.
- The script does not read Trading Panel account data.
- The script does not place, modify or close orders.
- Partial exits are not detected automatically.
- Position flips are not detected automatically.
- Remaining quantity must be updated manually.
- Realized P&L must be updated manually.
- Taxes are not calculated.
- Actual trading fees can differ by broker or exchange.
- Actual spread and slippage can differ from the entered assumptions.
- Funding and carry costs can vary over time.
- Currency conversion is not calculated automatically.
- Point value can differ by broker, exchange and contract specification.
- Cash P&L estimates depend on the accuracy of the selected point value.
- Live Price values can change while a realtime bar is open.
- Non-standard chart prices may not represent executable market prices.
- Alerts are disabled on non-standard charts.
- Results depend entirely on the accuracy of the user's inputs.
- The script is an arithmetic visualization and research tool.
- It is not financial advice or a trade recommendation.
日本語概要
このインジケーターは、手動入力したポジションの数量加重平均取得単価と、手数料、スプレッド、スリッページ、固定費、資金調達費などを反映した費用調整後の損益分岐価格を表示するオープンソースの研究ツールです。
主な機能:
- 既知の平均取得単価、または最大8件の個別約定から計算
- ロング・ショート双方に対応
- 平均取得単価、コスト差、損益分岐価格、現在価格との差を表示
- Campaign Recovery、Next Fill、Target Calculation
- 約定集中度、加重分散、実効約定件数
- 確定足による事実通知アラート
- 12言語のオンチャート表示
ポジション情報はすべて手動入力です。ブローカーのポジションやTrading Panelの口座情報を読み取らず、注文も送信しません。
表示結果は入力した価格、数量、手数料、ポイント価値などの正確性に依存します。本スクリプトは算術可視化・研究用であり、金融助言や売買推奨ではありません。
Average Entry Price and Fee-Adjusted Break-Even Workbench is an open-source position cost-basis and break-even research indicator. It reconstructs a manually entered position's average entry price, weighted average cost and DCA cost basis, then calculates a cost-adjusted and fee-adjusted break-even level after configurable trading fees, spread or slippage, fixed costs and funding adjustments.
The script supports Long and Short positions, a known average price or up to eight individual fills, scale-in research and position-management scenarios.
It does not predict market direction, generate trade recommendations, read broker positions, access Trading Panel account data or place orders.
Why average entry and break-even are different
A position's average entry price is not always the price at which its estimated net result becomes zero.
Entry fees, exit fees, spread, slippage, fixed order costs and funding adjustments can move the effective break-even away from the weighted average entry.
The script separates three values that are often treated as one:
- Weighted average entry price
- Cost impact between the average entry and break-even
- Current price distance from the calculated break-even
Long and Short positions use separate equations. Percentage exit fees are solved algebraically instead of being approximated by adding a percentage directly to the average entry price.
Before a break-even result is displayed, the calculated level is reinserted into the normalized net P&L equation. The script checks the remaining residual and suppresses the result when the calculation health check does not pass.
Position input methods
The script provides two manual position-input methods.
Known average
Enter:
- Average entry price
- Remaining position quantity
- Long or Short side
This mode is suitable when the broker or another record already provides the current average entry price.
Individual fills
Enter up to eight fill prices and quantities.
The weighted average is calculated as:
Average entry price =
Sum of (fill price x fill quantity) / Sum of fill quantity
The selected number of fills determines which rows are used.
Optional dated fills can activate each fill from its specified time. When dated fills are enabled, the historical development of the weighted average can also be displayed.
Fill validation can either:
- Require all selected rows to contain valid price and quantity values
- Use only the valid rows and report how many selected fills were used
Cost-adjusted break-even
The break-even calculation can include:
- Entry fee as a percentage of entry notional
- Exit fee as a percentage of estimated exit notional
- Exit friction in ticks
- Exit friction in price units
- Fixed entry cost per order
- Fixed exit cost
- Carry or funding adjustment
- Other cash cost or credit
Exit friction can be used to represent a configurable spread or slippage assumption.
Positive fee and cash values represent costs.
Negative percentage fees, carry values or other adjustments can represent rebates or credits where applicable.
The normalized calculation concept is:
Long break-even =
Exit friction
+ (((1 + entry fee rate) x average entry price) + cash cost per unit)
/ (1 - exit fee rate)
Short break-even =
(((1 - entry fee rate) x average entry price) - cash cost per unit)
/ (1 + exit fee rate)
- exit friction
The displayed Long break-even is rounded upward to the symbol's minimum tick.
The displayed Short break-even is rounded downward to the symbol's minimum tick.
Internal calculations retain the unrounded value.
Price Only and Full Cash models
The script separates price-based calculations from cash-converted calculations.
Price Only
Percentage fees and price friction can be calculated without a point value when no fixed cash adjustments are included.
This allows the average entry, break-even, Cost Delta and current-price distance to remain available even when a reliable point value is not available.
Full Cash
Fixed cash costs, realized P&L adjustments and estimated cash P&L require a valid point value.
The script uses the symbol's point value when available. A Point Value Override can be entered when the automatic value does not match the broker, exchange or contract specification being researched.
If cash costs are entered without a valid point value, the script does not silently ignore them. It displays a Point Value Needed state instead.
Chart display
The default Overview layout provides a compact summary of:
- AVG: weighted average entry price
- COST Delta: directional difference between average entry and break-even
- BE: cost-adjusted break-even price
- VS BE: directional distance between current price and break-even
The main chart visuals use:
- A cyan solid line for the weighted average entry price
- An orange dashed line for the cost-adjusted break-even
- A shaded Cost Gap between the average and break-even
- Optional fill markers
- An optional historical weighted-average path
- A compact Position Panel
A positive VS BE value means price is on the favorable side of the calculated break-even for the selected Long or Short position.
A negative VS BE value means price is on the unfavorable side.
This is an arithmetic position-status display. It is not a trading signal.
Position Panel
The Position Panel summarizes the position without requiring the user to inspect every setting.
Depending on the selected panel mode, it can display:
- Input method
- Long or Short side
- Weighted average entry
- Cost Delta
- Cost-adjusted break-even
- Current price distance from break-even
- Price Only or Full Cash model status
- Estimated net cash P&L
- Campaign Recovery break-even
- Next Fill preview
- Target Calculation result
- Fill concentration
- Weighted fill-price dispersion
- Effective fill count
- Calculation residual
The default Bottom Left position includes transparent clearance intended to reduce overlap with TradingView's bottom-left platform mark.
The panel can be set to:
- Off
- Compact
- Overview
- Detailed
Label layout and collision handling
Label placement can be set to:
- Auto
- Split
- Combined
- Right edge
- Off
Auto mode separates the AVG and BE labels when practical.
When the two levels are visually close, Auto mode combines AVG, BE and the cost difference into one label to reduce chart congestion.
The visual-separation model uses:
- The symbol's minimum tick
- ATR
- A recent high-low range
- The configured line span
These values act as price-space proxies for how close labels may appear.
Pine Script cannot read browser zoom, display DPI or exact on-screen pixel coordinates. The collision system therefore reduces likely overlap without claiming pixel-perfect detection.
Campaign and Next Fill labels yield to the primary AVG and BE labels when their levels are too close. Their values remain available in the Detailed panel.
The Current vs BE chart note is optional and disabled by default to keep the chart clean.
Scenario research
Campaign Recovery
Campaign Recovery calculates a separate break-even using manually entered realized P&L from previous partial exits.
A positive realized P&L value reduces the remaining recovery requirement.
A negative realized P&L value increases the remaining recovery requirement.
The result is an arithmetic recovery level based on the entered values. It is not a recovery guarantee.
Next Fill
Next Fill previews:
- New total quantity
- New weighted average entry price
- New cost-adjusted break-even after a proposed additional fill
This is a scenario calculation only. It is not a recommendation to add to a position.
Target Calculation
Target Calculation determines the arithmetic quantity required to reach either:
- A target average entry price
- A target fee-adjusted break-even price
The result is checked by reinserting the calculated quantity into the target calculation.
The resulting quantity is not a recommended, optimal or safe position size.
Adding to a position increases exposure and can magnify losses.
Fill statistics
When Individual Fills is used, the Detailed panel can display:
- Largest fill share
- Weighted fill-price dispersion
- Effective fill count
These statistics help users inspect whether the cost basis is concentrated in one large fill or distributed across several fills.
Alerts
The script provides factual alert conditions for:
- Price crossing the average entry
- Price crossing the cost-adjusted break-even
- Price entering the Cost Gap
- Price exiting the Cost Gap
- Price crossing the optional Campaign Recovery break-even
- Price crossing the optional Next Fill preview break-even
Alerts are evaluated on confirmed bars.
Alert conditions require:
- A valid position
- A healthy break-even calculation
- A standard chart
- A stable calculated level
Alerts are disabled on non-standard charts.
Users must create the desired alerts separately through TradingView's alert dialog.
Realtime and historical behavior
The script does not use future data, lookahead or higher-timeframe data requests.
Live Price mode allows the Position Panel to update during an open realtime bar.
Confirmed Close mode uses the most recent confirmed close while the current realtime bar remains unfinished.
Alerts remain confirmed-bar events regardless of the selected panel price mode.
Changing an input causes the chart history to be recalculated using the new settings.
When dated fills are enabled, each fill becomes active from its manually specified time.
Non-standard charts
Heikin Ashi, Renko, Kagi, Line Break and Point & Figure prices can be synthetic.
User-entered average and break-even levels remain arithmetic levels, but the chart close may not represent an executable market price.
For this reason:
- Current-price calculations are restricted by default
- A synthetic-chart warning remains visible
- Alerts are disabled on non-standard charts
Languages
On-chart text can be selected manually in:
- English
- Japanese
- Spanish
- Portuguese (Brazil)
- German
- French
- Simplified Chinese
- Traditional Chinese
- Korean
- Turkish
- Russian
- Indonesian
English can optionally be displayed alongside the selected language.
Pine Script does not automatically read the TradingView interface language. The display language must be selected manually in the indicator settings.
Settings use stable field identifiers such as:
- P for position settings
- C for cost settings
- F for individual fills
- R for research tools
- D for display settings
- A for advanced settings
An optional localized setup guide maps the main field identifiers to the selected on-chart language.
Main interface terms
AVG = Weighted average entry price
COST Delta = Cost impact between average entry and break-even
BE = Cost-adjusted break-even price
VS BE = Current price distance from break-even
ABOVE BE = Current price is above break-even
BELOW BE = Current price is below break-even
NEAR BE = Current price is within the configured near-break-even tolerance
FULL CASH = A point value is available for cash-converted calculations
PRICE ONLY = Price calculations are available without cash conversion
POINT VALUE NEEDED = A valid point value is required for the entered cash adjustments
Basic use
1. Select Known Average or Individual Fills.
2. Select Long or Short.
3. Enter the average price and remaining quantity, or enter the selected fill prices and quantities.
4. Enter the applicable entry fee, exit fee and exit friction.
5. Enable Detailed Cash Costs only when fixed cash, funding or other cash adjustments are required.
6. Enter a Point Value Override when the automatic symbol value does not match the relevant contract specification.
7. Select the preferred layout, panel position, language, contrast and label configuration.
8. Create any required confirmed-bar alerts through TradingView's alert dialog.
Limitations
- All position information is entered manually.
- The script does not read an actual broker position.
- The script does not read Trading Panel account data.
- The script does not place, modify or close orders.
- Partial exits are not detected automatically.
- Position flips are not detected automatically.
- Remaining quantity must be updated manually.
- Realized P&L must be updated manually.
- Taxes are not calculated.
- Actual trading fees can differ by broker or exchange.
- Actual spread and slippage can differ from the entered assumptions.
- Funding and carry costs can vary over time.
- Currency conversion is not calculated automatically.
- Point value can differ by broker, exchange and contract specification.
- Cash P&L estimates depend on the accuracy of the selected point value.
- Live Price values can change while a realtime bar is open.
- Non-standard chart prices may not represent executable market prices.
- Alerts are disabled on non-standard charts.
- Results depend entirely on the accuracy of the user's inputs.
- The script is an arithmetic visualization and research tool.
- It is not financial advice or a trade recommendation.
日本語概要
このインジケーターは、手動入力したポジションの数量加重平均取得単価と、手数料、スプレッド、スリッページ、固定費、資金調達費などを反映した費用調整後の損益分岐価格を表示するオープンソースの研究ツールです。
主な機能:
- 既知の平均取得単価、または最大8件の個別約定から計算
- ロング・ショート双方に対応
- 平均取得単価、コスト差、損益分岐価格、現在価格との差を表示
- Campaign Recovery、Next Fill、Target Calculation
- 約定集中度、加重分散、実効約定件数
- 確定足による事実通知アラート
- 12言語のオンチャート表示
ポジション情報はすべて手動入力です。ブローカーのポジションやTrading Panelの口座情報を読み取らず、注文も送信しません。
表示結果は入力した価格、数量、手数料、ポイント価値などの正確性に依存します。本スクリプトは算術可視化・研究用であり、金融助言や売買推奨ではありません。
Release Notes
Improved readability and visual consistency across the settings, tooltips, labels, status messages, and Position Panel. The interface is now English-only, and the former language controls and automatic add-to-chart input prompt have been removed for a cleaner setup experience. All calculations, chart drawings, alerts, presets, and research functions remain unchanged.Open-source script
In true TradingView spirit, the creator of this script has made it open-source, so that traders can review and verify its functionality. Kudos to the author! While you can use it for free, remember that republishing the code is subject to our House Rules.

Disclaimer
The information and publications are not meant to be, and do not constitute, financial, investment, trading, or other types of advice or recommendations supplied or endorsed by TradingView. Read more in the Terms of Use.
Open-source script
In true TradingView spirit, the creator of this script has made it open-source, so that traders can review and verify its functionality. Kudos to the author! While you can use it for free, remember that republishing the code is subject to our House Rules.
Disclaimer
The information and publications are not meant to be, and do not constitute, financial, investment, trading, or other types of advice or recommendations supplied or endorsed by TradingView. Read more in the Terms of Use.