1H & 4H Swing High-Low Zones icc
# 1H & 4H Swing High-Low Zones
The **1H & 4H Swing High-Low Zones** indicator was built around the higher-timeframe structure concepts I use when applying the **TradesBySci ICC approach**.
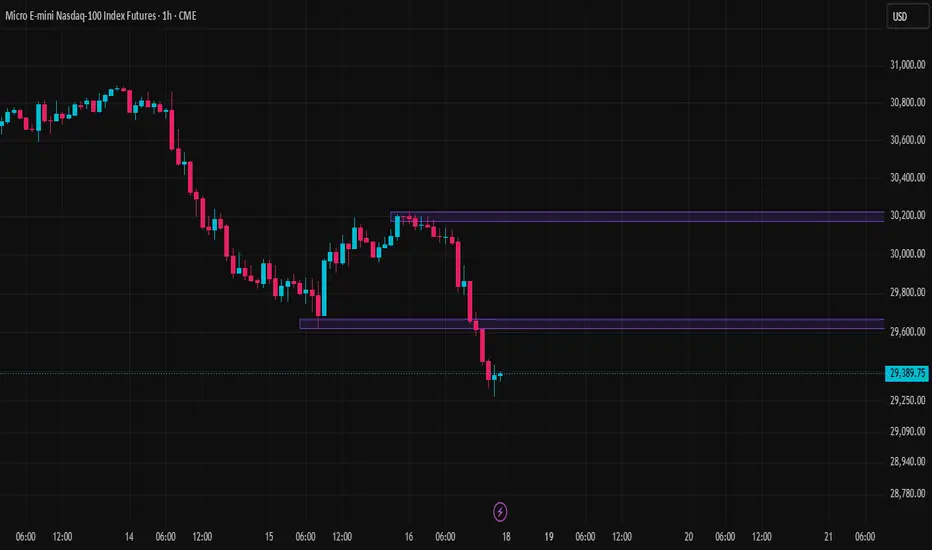
The purpose of the indicator is to automatically identify and display important **4-hour and 1-hour swing high and swing low zones**, making it easier to see where price may interact with significant higher-timeframe structure without constantly switching between charts.
## The Concept
The **4H timeframe provides the larger structural context**, while the **1H timeframe provides a more refined view of structure inside that context**.
Rather than drawing every previous high and low, the indicator focuses on the **latest confirmed swing high and swing low** from each timeframe.
This gives four primary areas to monitor:
- **4H Swing High Zone** — Major higher-timeframe upside structure
- **4H Swing Low Zone** — Major higher-timeframe downside structure
- **1H Swing High Zone** — More refined short-term upside structure
- **1H Swing Low Zone** — More refined short-term downside structure
These zones can be used to help identify areas where price may **break structure, reject, reclaim, retest, or continue through a previous swing**.
## Swing Detection
Swing highs and lows are detected using confirmed pivot structure.
A swing is not plotted immediately when price creates a high or low. The indicator waits for the selected number of bars on the right side of the pivot before considering that swing confirmed.
This helps filter out some of the noise that comes from treating every temporary high or low as meaningful structure.
The default setting uses:
**3 bars left + 3 bars right**
Increasing the pivot settings generally produces fewer but more significant swings, while decreasing them makes the indicator more sensitive to short-term structure.
## ATR-Based Zones
Instead of displaying each swing as a single exact price line, the indicator creates a **zone around the swing level**.
Zone thickness is calculated using ATR from the swing's own timeframe.
This allows the zones to automatically adjust to market volatility rather than using a fixed number of points or ticks across every market.
By default, zone thickness is:
**0.10 × ATR**
This can be adjusted in the settings.
## How I Use It With ICC
The zones are intended to provide **structural context**, not automatic buy or sell signals.
The main idea is to watch how price behaves around the 4H structure and then use the 1H structure for additional confirmation or refinement.
For example, a trader may monitor:
**4H structure → 1H structure → lower-timeframe confirmation**
The important part isn't simply that price touched a zone. What matters is what price **does around that structure** — whether it respects it, rejects it, breaks through it, or establishes new structure beyond it.
This makes the indicator especially useful alongside my **4H + 15m Alignment Trend Candles**, where one tool provides directional alignment and this indicator provides the structural areas where that direction can be evaluated.
## Customization
You can independently control:
- 1H swing zones
- 4H swing zones
- Pivot sensitivity
- ATR calculation length
- Zone thickness
- 1H zone colors
- 4H zone colors
## Important
Swing zones are based on **confirmed pivots**, meaning a new swing requires future candles to confirm it. Because of this, zones intentionally appear after the actual swing occurred.
This indicator does **not** predict reversals or automatically confirm an ICC setup. It is designed as a visual structure tool to make 4H and 1H swing locations easier to identify and incorporate into a broader trading model.
**Concept inspired by the 4H/1H structural framework used in TradesBySci's ICC methodology.**
The **1H & 4H Swing High-Low Zones** indicator was built around the higher-timeframe structure concepts I use when applying the **TradesBySci ICC approach**.
The purpose of the indicator is to automatically identify and display important **4-hour and 1-hour swing high and swing low zones**, making it easier to see where price may interact with significant higher-timeframe structure without constantly switching between charts.
## The Concept
The **4H timeframe provides the larger structural context**, while the **1H timeframe provides a more refined view of structure inside that context**.
Rather than drawing every previous high and low, the indicator focuses on the **latest confirmed swing high and swing low** from each timeframe.
This gives four primary areas to monitor:
- **4H Swing High Zone** — Major higher-timeframe upside structure
- **4H Swing Low Zone** — Major higher-timeframe downside structure
- **1H Swing High Zone** — More refined short-term upside structure
- **1H Swing Low Zone** — More refined short-term downside structure
These zones can be used to help identify areas where price may **break structure, reject, reclaim, retest, or continue through a previous swing**.
## Swing Detection
Swing highs and lows are detected using confirmed pivot structure.
A swing is not plotted immediately when price creates a high or low. The indicator waits for the selected number of bars on the right side of the pivot before considering that swing confirmed.
This helps filter out some of the noise that comes from treating every temporary high or low as meaningful structure.
The default setting uses:
**3 bars left + 3 bars right**
Increasing the pivot settings generally produces fewer but more significant swings, while decreasing them makes the indicator more sensitive to short-term structure.
## ATR-Based Zones
Instead of displaying each swing as a single exact price line, the indicator creates a **zone around the swing level**.
Zone thickness is calculated using ATR from the swing's own timeframe.
This allows the zones to automatically adjust to market volatility rather than using a fixed number of points or ticks across every market.
By default, zone thickness is:
**0.10 × ATR**
This can be adjusted in the settings.
## How I Use It With ICC
The zones are intended to provide **structural context**, not automatic buy or sell signals.
The main idea is to watch how price behaves around the 4H structure and then use the 1H structure for additional confirmation or refinement.
For example, a trader may monitor:
**4H structure → 1H structure → lower-timeframe confirmation**
The important part isn't simply that price touched a zone. What matters is what price **does around that structure** — whether it respects it, rejects it, breaks through it, or establishes new structure beyond it.
This makes the indicator especially useful alongside my **4H + 15m Alignment Trend Candles**, where one tool provides directional alignment and this indicator provides the structural areas where that direction can be evaluated.
## Customization
You can independently control:
- 1H swing zones
- 4H swing zones
- Pivot sensitivity
- ATR calculation length
- Zone thickness
- 1H zone colors
- 4H zone colors
## Important
Swing zones are based on **confirmed pivots**, meaning a new swing requires future candles to confirm it. Because of this, zones intentionally appear after the actual swing occurred.
This indicator does **not** predict reversals or automatically confirm an ICC setup. It is designed as a visual structure tool to make 4H and 1H swing locations easier to identify and incorporate into a broader trading model.
**Concept inspired by the 4H/1H structural framework used in TradesBySci's ICC methodology.**

Disclaimer
The information and publications are not meant to be, and do not constitute, financial, investment, trading, or other types of advice or recommendations supplied or endorsed by TradingView. Read more in the Terms of Use.
Disclaimer
The information and publications are not meant to be, and do not constitute, financial, investment, trading, or other types of advice or recommendations supplied or endorsed by TradingView. Read more in the Terms of Use.