OPEN-SOURCE SCRIPT
VolEdge: 0DTE Vol Context
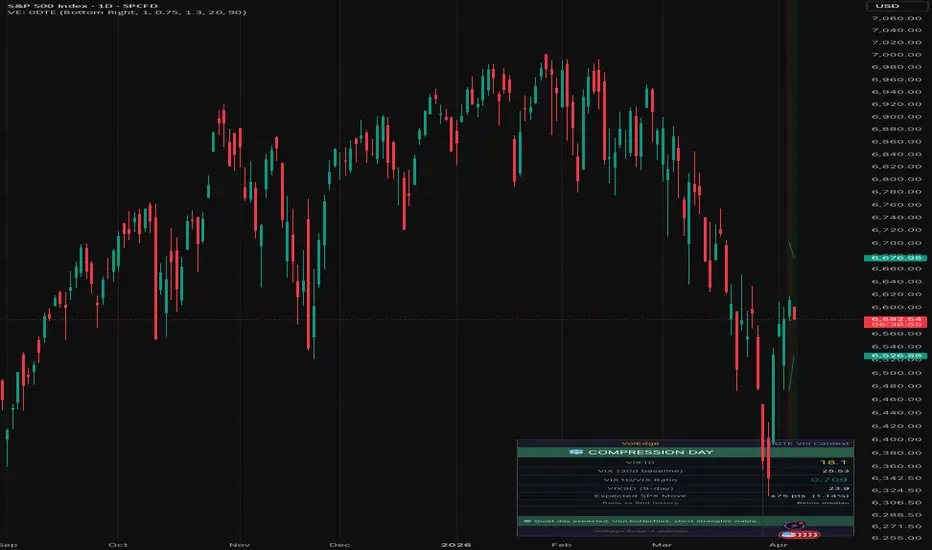
Hi everyone! Serge is here! Your feedback is highly appreciated.
Consider two mornings where VIX sits at 18. On the first, VIX1D reads 14 — the options market is pricing a quiet session, roughly ±0.9% on SPX. An iron butterfly-centered at the open makes sense. On the second morning, VIX1D reads 22 — today is expected to move nearly 40% more than the 30-day baseline implies. The same iron butterfly could blow through its short strikes before lunch.
This indicator surfaces that difference before you put on a trade.
What it does
Pulls CBOE's VIX1D index (1-day implied volatility), compares it against VIX (30-day baseline), and produces four outputs:
1. Day type classification
The VIX1D/VIX ratio is the core signal. When the ratio is at or above 1.0, the market is pricing today as more volatile than a typical day this month. When it sits at or below 0.75, today is expected to be quieter than normal. Four buckets:
EXPANSION DAY — ratio at or above 1.0. Above-average move priced in. Directional debit spreads and long straddles are better positioned than pure theta plays.
EVENT DAY — ratio at or above 1.30. Something significant is priced in — Fed minutes, CPI, or an intraday shock. This is not the environment for short premium without substantial width and reduced size.
COMPRESSION DAY — ratio at or below 0.75. Quieter than normal. Iron butterflies, short strangles, and narrow credit spreads work best when the market expects to grind.
NORMAL DAY — ratio between thresholds. Standard 0DTE setups apply; use VIX9D for the short-term weekly context.
2. Expected SPX move in points and percent
VIX1D is annualized. Dividing by the square root of 252 converts it to a single-day 1 standard deviation move. On a day where VIX1D is 16, the expected move is roughly plus or minus 1.0% — about 53 SPX points at current levels. Approximately 68% of sessions close within this range. The indicator displays both the point and percentage values, and optionally draws the bands on your chart anchored to today's open.
3. Historical context for the ratio
Today's VIX1D/VIX ratio is percentile-ranked against the past 90 days (adjustable). If the ratio is in the top 10% of recent history, the indicator flags it. A ratio that looks elevated in absolute terms may be ordinary for the current regime; percentile ranking removes that ambiguity.
4. VIX9D as a bridge
VIX1D covers today. VIX covers the next 30 days. VIX9D sits between them and captures the short-term weekly risk window — useful context when today reads Normal but a known event lands later in the week.
How to use it
Check the panel before sizing any 0DTE position. The day type and strategy tip give you the framework; the expected move and ratio percentile give you the calibration.
On an Expansion Day, widen your strikes or reduce size. The market has already priced in a larger move — selling a narrow butterfly into that environment means your tent is too small for the storm that's priced in.
On a Compression Day, tighten your structures. Theta burns fastest in quiet sessions, and the options market is telling you it expects quiet. This is where iron butterflies and short strangles earn their keep.
On an Event Day, the default answer is to sit out or cut size significantly. If you do trade, treat it as a directional bet, not a theta play — the implied move is large enough that short premium needs substantial wing width to survive.
On a Normal Day, use the expected move bands as your tent anchor and check VIX9D to make sure nothing is brewing later in the week.
Inputs
Show expected move lines on chart — draws the plus/minus 1 standard deviation bands anchored to today's SPX open
Show data table — toggle the panel on or off
Table position — top right, top left, bottom right, or bottom left
Expansion threshold — the VIX1D/VIX ratio at which the day is classified as Expansion (default 1.00)
Event threshold — the ratio at which the day escalates to Event (default 1.30)
Compression threshold — the ratio at or below which the day is classified as Compression (default 0.75)
Alert VIX1D level — fires when VIX1D crosses above this absolute level
Lookback for percentile — how many trading days to use when ranking today's ratio (default 90)
Alerts
Three alert conditions are available. Set them once and let them run pre-market.
VIX1D crosses above your chosen threshold — useful as an absolute spike warning
VIX1D/VIX ratio enters the top 10% of recent history — fires when today's relative vol is a genuine outlier, regardless of the absolute VIX level
Day type changes — fires when the classification shifts, for example from Normal to Expansion intraday
Data sources
CBOE:VIX1D, CBOE:VIX, CBOE:VIX9D, SP:SPX. All fetched on the daily timeframe. The indicator works correctly on intraday charts — all vol data is anchored to the daily close regardless of chart resolution.
Consider two mornings where VIX sits at 18. On the first, VIX1D reads 14 — the options market is pricing a quiet session, roughly ±0.9% on SPX. An iron butterfly-centered at the open makes sense. On the second morning, VIX1D reads 22 — today is expected to move nearly 40% more than the 30-day baseline implies. The same iron butterfly could blow through its short strikes before lunch.
This indicator surfaces that difference before you put on a trade.
What it does
Pulls CBOE's VIX1D index (1-day implied volatility), compares it against VIX (30-day baseline), and produces four outputs:
1. Day type classification
The VIX1D/VIX ratio is the core signal. When the ratio is at or above 1.0, the market is pricing today as more volatile than a typical day this month. When it sits at or below 0.75, today is expected to be quieter than normal. Four buckets:
EXPANSION DAY — ratio at or above 1.0. Above-average move priced in. Directional debit spreads and long straddles are better positioned than pure theta plays.
EVENT DAY — ratio at or above 1.30. Something significant is priced in — Fed minutes, CPI, or an intraday shock. This is not the environment for short premium without substantial width and reduced size.
COMPRESSION DAY — ratio at or below 0.75. Quieter than normal. Iron butterflies, short strangles, and narrow credit spreads work best when the market expects to grind.
NORMAL DAY — ratio between thresholds. Standard 0DTE setups apply; use VIX9D for the short-term weekly context.
2. Expected SPX move in points and percent
VIX1D is annualized. Dividing by the square root of 252 converts it to a single-day 1 standard deviation move. On a day where VIX1D is 16, the expected move is roughly plus or minus 1.0% — about 53 SPX points at current levels. Approximately 68% of sessions close within this range. The indicator displays both the point and percentage values, and optionally draws the bands on your chart anchored to today's open.
3. Historical context for the ratio
Today's VIX1D/VIX ratio is percentile-ranked against the past 90 days (adjustable). If the ratio is in the top 10% of recent history, the indicator flags it. A ratio that looks elevated in absolute terms may be ordinary for the current regime; percentile ranking removes that ambiguity.
4. VIX9D as a bridge
VIX1D covers today. VIX covers the next 30 days. VIX9D sits between them and captures the short-term weekly risk window — useful context when today reads Normal but a known event lands later in the week.
How to use it
Check the panel before sizing any 0DTE position. The day type and strategy tip give you the framework; the expected move and ratio percentile give you the calibration.
On an Expansion Day, widen your strikes or reduce size. The market has already priced in a larger move — selling a narrow butterfly into that environment means your tent is too small for the storm that's priced in.
On a Compression Day, tighten your structures. Theta burns fastest in quiet sessions, and the options market is telling you it expects quiet. This is where iron butterflies and short strangles earn their keep.
On an Event Day, the default answer is to sit out or cut size significantly. If you do trade, treat it as a directional bet, not a theta play — the implied move is large enough that short premium needs substantial wing width to survive.
On a Normal Day, use the expected move bands as your tent anchor and check VIX9D to make sure nothing is brewing later in the week.
Inputs
Show expected move lines on chart — draws the plus/minus 1 standard deviation bands anchored to today's SPX open
Show data table — toggle the panel on or off
Table position — top right, top left, bottom right, or bottom left
Expansion threshold — the VIX1D/VIX ratio at which the day is classified as Expansion (default 1.00)
Event threshold — the ratio at which the day escalates to Event (default 1.30)
Compression threshold — the ratio at or below which the day is classified as Compression (default 0.75)
Alert VIX1D level — fires when VIX1D crosses above this absolute level
Lookback for percentile — how many trading days to use when ranking today's ratio (default 90)
Alerts
Three alert conditions are available. Set them once and let them run pre-market.
VIX1D crosses above your chosen threshold — useful as an absolute spike warning
VIX1D/VIX ratio enters the top 10% of recent history — fires when today's relative vol is a genuine outlier, regardless of the absolute VIX level
Day type changes — fires when the classification shifts, for example from Normal to Expansion intraday
Data sources
CBOE:VIX1D, CBOE:VIX, CBOE:VIX9D, SP:SPX. All fetched on the daily timeframe. The indicator works correctly on intraday charts — all vol data is anchored to the daily close regardless of chart resolution.
Open-source script
In true TradingView spirit, the creator of this script has made it open-source, so that traders can review and verify its functionality. Kudos to the author! While you can use it for free, remember that republishing the code is subject to our House Rules.

Disclaimer
The information and publications are not meant to be, and do not constitute, financial, investment, trading, or other types of advice or recommendations supplied or endorsed by TradingView. Read more in the Terms of Use.
Open-source script
In true TradingView spirit, the creator of this script has made it open-source, so that traders can review and verify its functionality. Kudos to the author! While you can use it for free, remember that republishing the code is subject to our House Rules.
Disclaimer
The information and publications are not meant to be, and do not constitute, financial, investment, trading, or other types of advice or recommendations supplied or endorsed by TradingView. Read more in the Terms of Use.