OPEN-SOURCE SCRIPT
Bitcoin Logarithmic Regression Oscillator
Overview
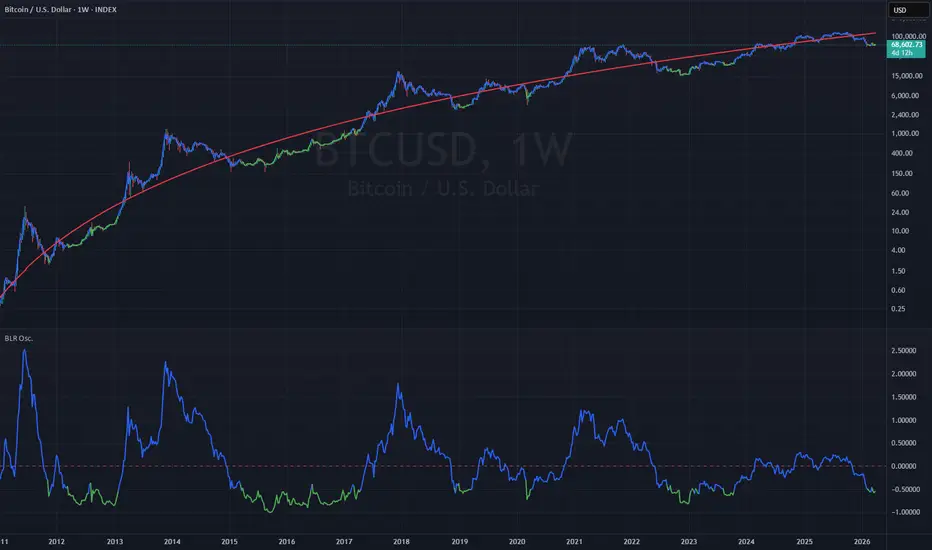
The Bitcoin Logarithmic Regression Oscillator (BLR Osc.) is an analytical tool designed to measure Bitcoin's price deviation from its historical logarithmic growth curve. By comparing the current price to a mathematical "fair value," this indicator helps traders and investors identify macroeconomic accumulation zones and potential market cycle peaks.
How it Works
Historically, Bitcoin's price action has followed a non-linear, logarithmic growth trajectory where the rate of growth slows down over time. This script calculates a theoretical "fair value" based on the number of days since the first available price data, using the following logarithmic regression model:
Pine Script®
The oscillator at the bottom of the chart represents the natural logarithm of the ratio between the current closing price and this fair valuePine Script®
How to Use
Monitor the oscillator in the lower pane to gauge the current stage of the market cycle. When the oscillator drops below the user-defined Buy Threshold (default is -0.50), the script highlights these undervalued zones by turning both the oscillator line and the price line green.
💡 Visualization Tip:
Curve Calibration & Customization
The default mathematical coefficients provided in this script are based on an approximation fitted on March 30, 2026 (with an R² = 0.9720).
Because the logarithmic curve requires periodic recalibration as new market data emerges, advanced users can perform their own mathematical approximations. You can easily update the coefficients by entering your new a (slope), b (intercept), and offset (days) values directly into the indicator's settings menu under the "Logarithmic Regression" group. There is no need to edit the source code.
The Bitcoin Logarithmic Regression Oscillator (BLR Osc.) is an analytical tool designed to measure Bitcoin's price deviation from its historical logarithmic growth curve. By comparing the current price to a mathematical "fair value," this indicator helps traders and investors identify macroeconomic accumulation zones and potential market cycle peaks.
How it Works
Historically, Bitcoin's price action has followed a non-linear, logarithmic growth trajectory where the rate of growth slows down over time. This script calculates a theoretical "fair value" based on the number of days since the first available price data, using the following logarithmic regression model:
The oscillator at the bottom of the chart represents the natural logarithm of the ratio between the current closing price and this fair value
- A value of 0 means the price is exactly at its fair value.
- Positive values indicate overvaluation and potential market exuberance (cycle tops).
- Negative values highlight undervaluation and accumulation phases (bear market bottoms).
How to Use
Monitor the oscillator in the lower pane to gauge the current stage of the market cycle. When the oscillator drops below the user-defined Buy Threshold (default is -0.50), the script highlights these undervalued zones by turning both the oscillator line and the price line green.
💡 Visualization Tip:
- If you want to see the regression curve and colored line on your main chart pane more clearly, you can hide the default standard Bitcoin candles using the chart's object tree/settings.
- Conversely, if you only want to use the oscillator in the lower pane and keep your main chart clean, simply uncheck the "Plot on the Main Pane" option in the indicator's settings.
Curve Calibration & Customization
The default mathematical coefficients provided in this script are based on an approximation fitted on March 30, 2026 (with an R² = 0.9720).
Because the logarithmic curve requires periodic recalibration as new market data emerges, advanced users can perform their own mathematical approximations. You can easily update the coefficients by entering your new a (slope), b (intercept), and offset (days) values directly into the indicator's settings menu under the "Logarithmic Regression" group. There is no need to edit the source code.
Open-source script
In true TradingView spirit, the creator of this script has made it open-source, so that traders can review and verify its functionality. Kudos to the author! While you can use it for free, remember that republishing the code is subject to our House Rules.

Disclaimer
The information and publications are not meant to be, and do not constitute, financial, investment, trading, or other types of advice or recommendations supplied or endorsed by TradingView. Read more in the Terms of Use.
Open-source script
In true TradingView spirit, the creator of this script has made it open-source, so that traders can review and verify its functionality. Kudos to the author! While you can use it for free, remember that republishing the code is subject to our House Rules.
Disclaimer
The information and publications are not meant to be, and do not constitute, financial, investment, trading, or other types of advice or recommendations supplied or endorsed by TradingView. Read more in the Terms of Use.