VWAP Range Breakout (Zeiierman)
More exclusive indicators from Zeiierman
Subscribe to Zeiierman for $95.20/month to get exclusive indicators by this author. You pay right on TradingView and can use them on your charts straight away.
Explore Zeiierman█ Overview
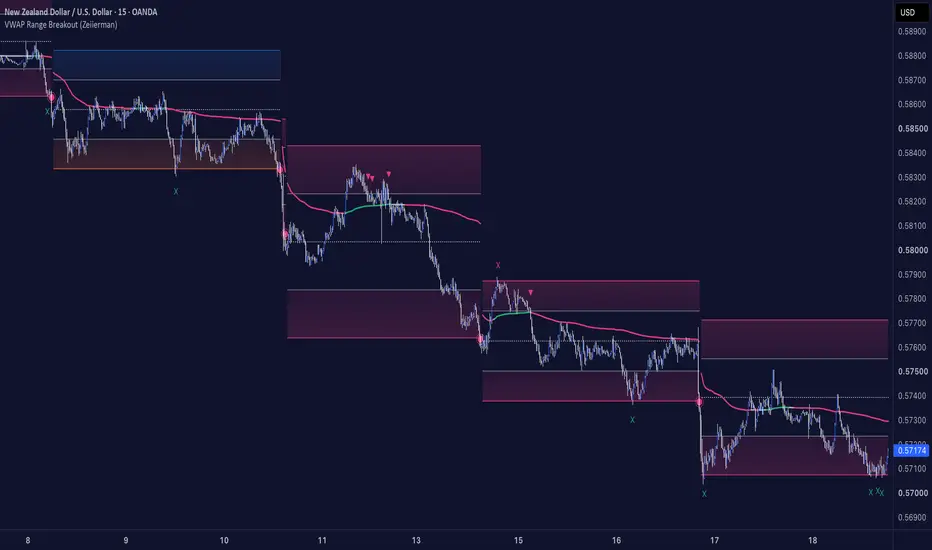
VWAP Range Breakout (Zeiierman) is a volume-weighted range and breakout indicator designed to identify horizontal price ranges, visualize directional market structure, and highlight potential breakout, rejection, and continuation opportunities.

Instead of continuously adjusting range boundaries with every price move, the indicator establishes fixed horizontal ranges based on VWAP-derived price dispersion. Each range stays active until price confirms a breakout above its upper or below its lower boundary.
The indicator combines three core components:
• VWAP Range = volume-weighted horizontal price structure
• Smart Trend = volatility-adaptive directional classification
• Range-Anchored VWAP = developing volume-weighted price equilibrium
The VWAP Range establishes the upper, lower, and central price levels. Smart Trend evaluates broader directional conditions and classifies each new range as bullish, bearish, or neutral.
Once a range is established, its boundaries and trend classification remain fixed until the next range forms.

Range coloring identifies the directional environment at the time of formation:
• Bullish Range = both upper and lower zones use the selected bullish color
• Bearish Range = both zones use the selected bearish color
• Neutral Range = upper and lower zones use independently selected colors
The range colors are locked at formation. Even if market conditions change while price remains inside the same range, the original classification and colors remain unchanged.
The indicator also identifies price reactions at the range boundaries:
• ▲ Bullish Arrow = recovery through the lower internal boundary
• ▼ Bearish Arrow = rejection through the upper internal boundary
• ◉ Breakout Circle = confirmed breakout beyond the outer range boundary
• X Marker = price returning through an outer boundary after an excursion
A separate Range-Anchored VWAP continuously tracks the developing volume-weighted price within each range. Its line can be colored using Trend, Slope, Price, or the experimental Value Transfer model.
This provides an additional perspective on whether price movement is supported by changes in the underlying volume-weighted equilibrium.

█ How It Works
⚪ VWAP Range Engine
The range engine calculates a volume-weighted price center using the Re-anchor period.
A separate rolling VWAP measures the equilibrium reference, while historical price deviations from that reference determine the range width.
Pine Script®
The final width also includes a minimum price coverage requirement so that the candle forming the new range is contained within its boundaries. Once established, the center and outer boundaries remain fixed.
A bullish breakout occurs when a confirmed candle moves entirely above the upper boundary. A bearish breakout occurs when a confirmed candle moves entirely below the lower boundary. The breakout establishes a new range using the current volume-weighted conditions.
⚪ Smart Trend
Smart Trend uses a longer rolling VWAP together with a volatility-adaptive structure model. The engine measures changes in VWAP structure using ATR, relative volatility, and normalized volatility conditions. An internal reversal-anchored VWAP provides an additional directional reference.
Bullish conditions require upward structural direction and price agreement above both VWAP references. Bearish conditions require downward structural direction and price agreement below both references.
The model uses consecutive-candle confirmation and separate release thresholds to reduce unnecessary trend-state changes.
Pine Script®
Smart Trend determines the classification assigned to each new range. It can also optionally filter bullish and bearish arrows.
⚪ Range-Anchored VWAP
The Range-Anchored VWAP is initialized using 34 candles of historical price-volume data when a new range forms. Unlike the fixed range boundaries, this VWAP continues updating as additional candles are confirmed.
Pine Script®
This creates a developing equilibrium reference within each horizontal range.
The line supports four coloring modes:
• Trend: follows the internal Smart Trend state
• Slope: identifies whether the anchored VWAP is rising or falling
• Price: identifies whether price closes above or below VWAP
• Value Transfer: measures volume-weighted directional VWAP migration
Value Transfer is an experimental model that combines VWAP movement, relative volume, and price displacement from the anchored VWAP.
Its directional evidence is accumulated using a decaying memory calculation.
Pine Script®
Positive evidence can turn the line bullish, negative evidence bearish, while insufficient directional evidence produces a neutral color.
█ How to Use
VWAP Range Breakout can be used for Range Trading, Breakout Trading, Trend Continuation, and Breakout Retests.
The horizontal ranges identify key price boundaries, Smart Trend provides directional context, and the Range-Anchored VWAP tracks developing volume-weighted equilibrium.
⚪ Range Trading in Neutral Phases
When the range is classified as neutral, traders can use the arrows to identify potential opportunities as price rotates back and forth between the upper and lower boundaries.
The objective is to capture price reactions within the range until a confirmed breakout occurs and a new directional trend develops.
• Bullish ▲: Price recovers above the lower internal boundary, indicating a potential move toward the upper range.
• Bearish ▼: Price falls below the upper internal boundary, indicating a potential move toward the lower range.

⚪ Range Trading Within Confirmed Trends
When a range is classified as bullish or bearish, traders can use the arrows to identify potential trend continuation opportunities during temporary pullbacks.
Instead of trading both directions, the focus shifts toward price reactions that align with the established trend.
• Bullish ▲: During a bullish trend, price tests the lower range region and recovers, indicating a potential continuation higher.
• Bearish ▼: During a bearish trend, price tests the upper range region and rejects, indicating a potential continuation lower.
Enable Filter Arrows by Smart Trend to display only arrows aligned with the current confirmed trend direction.

⚪ Breakout Trading
A confirmed breakout occurs when an entire candle moves beyond the range boundary.
• Bullish ◉: The candle moves completely above the upper boundary.
• Bearish ◉: The candle moves completely below the lower boundary.
Each confirmed breakout establishes a new VWAP-based range.

⚪ VWAP Confirmation
The Range-Anchored VWAP shows how the volume-weighted equilibrium develops within each range.
Price above VWAP indicates trading above equilibrium, while price below indicates trading below equilibrium. Traders can look for a retest of the VWAP.
Use Trend, Slope, Price, or Value Transfer coloring to identify directional agreement or weakening momentum.

⚪ Fakeouts & Breakout Retests
X markers identify price returning through an outer range boundary, highlighting potential failed breakout attempts.
After a confirmed breakout, the former boundary can act as a potential support or resistance level.
• Bullish Retest: Price revisits the broken upper boundary and closes back above it.
• Bearish Retest: Price revisits the broken lower boundary and closes back below it.
Qualifying retests can trigger alerts within 12 candles after the breakout.

█ Settings
-----------------
Disclaimer
The content provided in my scripts, indicators, ideas, algorithms, and systems is for educational and informational purposes only. It does not constitute financial advice, investment recommendations, or a solicitation to buy or sell any financial instruments. I will not accept liability for any loss or damage, including without limitation any loss of profit, which may arise directly or indirectly from the use of or reliance on such information.
All investments involve risk, and the past performance of a security, industry, sector, market, financial product, trading strategy, backtest, or individual's trading does not guarantee future results or returns. Investors are fully responsible for any investment decisions they make. Such decisions should be based solely on an evaluation of their financial circumstances, investment objectives, risk tolerance, and liquidity needs.
VWAP Range Breakout (Zeiierman) is a volume-weighted range and breakout indicator designed to identify horizontal price ranges, visualize directional market structure, and highlight potential breakout, rejection, and continuation opportunities.
Instead of continuously adjusting range boundaries with every price move, the indicator establishes fixed horizontal ranges based on VWAP-derived price dispersion. Each range stays active until price confirms a breakout above its upper or below its lower boundary.
The indicator combines three core components:
• VWAP Range = volume-weighted horizontal price structure
• Smart Trend = volatility-adaptive directional classification
• Range-Anchored VWAP = developing volume-weighted price equilibrium
The VWAP Range establishes the upper, lower, and central price levels. Smart Trend evaluates broader directional conditions and classifies each new range as bullish, bearish, or neutral.
Once a range is established, its boundaries and trend classification remain fixed until the next range forms.
Range coloring identifies the directional environment at the time of formation:
• Bullish Range = both upper and lower zones use the selected bullish color
• Bearish Range = both zones use the selected bearish color
• Neutral Range = upper and lower zones use independently selected colors
The range colors are locked at formation. Even if market conditions change while price remains inside the same range, the original classification and colors remain unchanged.
The indicator also identifies price reactions at the range boundaries:
• ▲ Bullish Arrow = recovery through the lower internal boundary
• ▼ Bearish Arrow = rejection through the upper internal boundary
• ◉ Breakout Circle = confirmed breakout beyond the outer range boundary
• X Marker = price returning through an outer boundary after an excursion
A separate Range-Anchored VWAP continuously tracks the developing volume-weighted price within each range. Its line can be colored using Trend, Slope, Price, or the experimental Value Transfer model.
This provides an additional perspective on whether price movement is supported by changes in the underlying volume-weighted equilibrium.
█ How It Works
⚪ VWAP Range Engine
The range engine calculates a volume-weighted price center using the Re-anchor period.
A separate rolling VWAP measures the equilibrium reference, while historical price deviations from that reference determine the range width.
The final width also includes a minimum price coverage requirement so that the candle forming the new range is contained within its boundaries. Once established, the center and outer boundaries remain fixed.
A bullish breakout occurs when a confirmed candle moves entirely above the upper boundary. A bearish breakout occurs when a confirmed candle moves entirely below the lower boundary. The breakout establishes a new range using the current volume-weighted conditions.
⚪ Smart Trend
Smart Trend uses a longer rolling VWAP together with a volatility-adaptive structure model. The engine measures changes in VWAP structure using ATR, relative volatility, and normalized volatility conditions. An internal reversal-anchored VWAP provides an additional directional reference.
Bullish conditions require upward structural direction and price agreement above both VWAP references. Bearish conditions require downward structural direction and price agreement below both references.
The model uses consecutive-candle confirmation and separate release thresholds to reduce unnecessary trend-state changes.
Smart Trend determines the classification assigned to each new range. It can also optionally filter bullish and bearish arrows.
⚪ Range-Anchored VWAP
The Range-Anchored VWAP is initialized using 34 candles of historical price-volume data when a new range forms. Unlike the fixed range boundaries, this VWAP continues updating as additional candles are confirmed.
This creates a developing equilibrium reference within each horizontal range.
The line supports four coloring modes:
• Trend: follows the internal Smart Trend state
• Slope: identifies whether the anchored VWAP is rising or falling
• Price: identifies whether price closes above or below VWAP
• Value Transfer: measures volume-weighted directional VWAP migration
Value Transfer is an experimental model that combines VWAP movement, relative volume, and price displacement from the anchored VWAP.
Its directional evidence is accumulated using a decaying memory calculation.
Positive evidence can turn the line bullish, negative evidence bearish, while insufficient directional evidence produces a neutral color.
█ How to Use
VWAP Range Breakout can be used for Range Trading, Breakout Trading, Trend Continuation, and Breakout Retests.
The horizontal ranges identify key price boundaries, Smart Trend provides directional context, and the Range-Anchored VWAP tracks developing volume-weighted equilibrium.
⚪ Range Trading in Neutral Phases
When the range is classified as neutral, traders can use the arrows to identify potential opportunities as price rotates back and forth between the upper and lower boundaries.
The objective is to capture price reactions within the range until a confirmed breakout occurs and a new directional trend develops.
• Bullish ▲: Price recovers above the lower internal boundary, indicating a potential move toward the upper range.
• Bearish ▼: Price falls below the upper internal boundary, indicating a potential move toward the lower range.
⚪ Range Trading Within Confirmed Trends
When a range is classified as bullish or bearish, traders can use the arrows to identify potential trend continuation opportunities during temporary pullbacks.
Instead of trading both directions, the focus shifts toward price reactions that align with the established trend.
• Bullish ▲: During a bullish trend, price tests the lower range region and recovers, indicating a potential continuation higher.
• Bearish ▼: During a bearish trend, price tests the upper range region and rejects, indicating a potential continuation lower.
Enable Filter Arrows by Smart Trend to display only arrows aligned with the current confirmed trend direction.
⚪ Breakout Trading
A confirmed breakout occurs when an entire candle moves beyond the range boundary.
• Bullish ◉: The candle moves completely above the upper boundary.
• Bearish ◉: The candle moves completely below the lower boundary.
Each confirmed breakout establishes a new VWAP-based range.
⚪ VWAP Confirmation
The Range-Anchored VWAP shows how the volume-weighted equilibrium develops within each range.
Price above VWAP indicates trading above equilibrium, while price below indicates trading below equilibrium. Traders can look for a retest of the VWAP.
Use Trend, Slope, Price, or Value Transfer coloring to identify directional agreement or weakening momentum.
⚪ Fakeouts & Breakout Retests
X markers identify price returning through an outer range boundary, highlighting potential failed breakout attempts.
After a confirmed breakout, the former boundary can act as a potential support or resistance level.
• Bullish Retest: Price revisits the broken upper boundary and closes back above it.
• Bearish Retest: Price revisits the broken lower boundary and closes back below it.
Qualifying retests can trigger alerts within 12 candles after the breakout.
█ Settings
- Re-anchor: Controls the volume-weighted price window used to establish the center of each new horizontal range. Lower values respond more closely to recent prices.
- Equilibrium: Controls the rolling VWAP length used as the reference for price dispersion.
- Deviation Memory: Determines how many historical candles contribute to the VWAP-relative dispersion calculation.
- VWAP Length: Controls the rolling VWAP period used by the underlying trend structure. Higher values produce a slower directional reference.
- Sensitivity: Controls the volatility-adjusted distance required for structural transitions. Higher values generally produce fewer structure changes.
- Filter Arrows by Smart Trend: Restricts bullish arrows to confirmed bullish trend conditions and bearish arrows to confirmed bearish conditions.
-----------------
Disclaimer
The content provided in my scripts, indicators, ideas, algorithms, and systems is for educational and informational purposes only. It does not constitute financial advice, investment recommendations, or a solicitation to buy or sell any financial instruments. I will not accept liability for any loss or damage, including without limitation any loss of profit, which may arise directly or indirectly from the use of or reliance on such information.
All investments involve risk, and the past performance of a security, industry, sector, market, financial product, trading strategy, backtest, or individual's trading does not guarantee future results or returns. Investors are fully responsible for any investment decisions they make. Such decisions should be based solely on an evaluation of their financial circumstances, investment objectives, risk tolerance, and liquidity needs.

Access my indicators at: zeiierman.com
Join Our Free Discord: discord.gg/zeiiermantrading
Join Our Free Discord: discord.gg/zeiiermantrading
Disclaimer
The information and publications are not meant to be, and do not constitute, financial, investment, trading, or other types of advice or recommendations supplied or endorsed by TradingView. Read more in the Terms of Use.
Access my indicators at: zeiierman.com
Join Our Free Discord: discord.gg/zeiiermantrading
Join Our Free Discord: discord.gg/zeiiermantrading
Disclaimer
The information and publications are not meant to be, and do not constitute, financial, investment, trading, or other types of advice or recommendations supplied or endorsed by TradingView. Read more in the Terms of Use.