Updated
Kekkai Barrier - Session Walls, Sweeps & Shifts
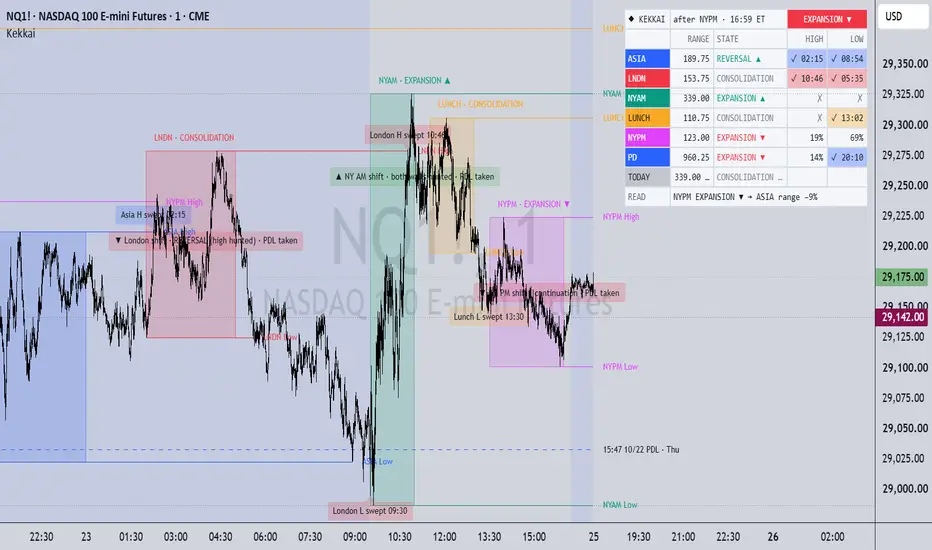
Every session leaves walls behind, and the next session comes to hunt them. Kekkai draws that hunt on your chart, so you can see whose liquidity is being taken, when it’s taken, and what price does next.
This is a confluence map, not a signal. Use it next to your own model. It’s open source, so take it, test it, break it and build on it.
If you’re still here, still studying, still showing up after the losing days, you’re already ahead of most people who started with you. Nobody hands you consistency. You build it one session at a time. Back yourself. Your edge comes from the reps nobody sees, so keep going.
How it works
Kekkai treats the trading day as a chain. Each session builds walls for the next one, and the next one hunts them.
Session (ET) Role
Asia 20:00–00:00 Builds London’s walls
London 02:00–05:00 Hunts the Asia high and low
NY AM 09:30–11:00 Hunts the London high and low
NY Lunch 11:30–13:00 Builds NY PM’s walls
NY PM 13:30–16:00 Hunts the Lunch high and low
It also draws the higher-timeframe walls on top: PDH/PDL, each day’s high and low this week, and the week and month high and low to date.
What you see
Walls: each session’s high and low, starting at the candle that printed it and running to the last candle. Labels sit on the right with the time and date the wall formed.
Sweeps: when the hunting session trades through a wall, it gets marked (e.g. “Asia H swept 02:47”) and the wall turns dashed.
Shifts: two consecutive 30-minute blocks printing higher highs and higher lows (▲), or lower lows and lower highs (▼), inside London, NY AM or NY PM. Each shift is labelled with what happened to the walls before it:
REVERSAL: one wall hunted, then price shifts away from it (hunt, then kill)
continuation: a wall swept, then price keeps going through it
both walls hunted
no sweep
The label also says whether PDH or PDL has already been taken that day.
Compression: a session is tagged “compressed” when its range is under 75% of its own 20-session average. The prior day gets “compressed day” on the same rule.
Higher-timeframe walls:
PDH / PDL
Each completed day’s high and low this week (Mon H, Tue L…)
Today’s high and low so far (dotted)
Week and month high/low to date (dotted, moving as new extremes print)
Previous week and month high/low (optional)
Day-of-week labels along the bottom.
Age colouring: drawings older than 5 trading days turn grey, so fresh levels stand out.
Settings
Sessions (ET)
Asia, London, NY AM, NY Lunch, NY PM: all fully adjustable.
Shift block length: 30 minutes. The last block is checked at the session close, so a 90-minute NY AM can only confirm a shift at 11:00.
Session walls
Show/hide and colour for the Asia, London and Lunch walls.
Wall midpoints: off by default.
Compression: average length 20, threshold 75%.
Day · Week · Month (exchange day, 18:00 ET start)
PDH / PDL
Each day’s high / low this week
Today’s high / low so far
Week high / low to date
Month high / low to date
Previous week / month high / low (off by default)
Line width
Day-of-week labels
Sweeps & shifts
Session-wall sweeps
PDH / PDL sweeps
Earlier-day sweeps (off by default)
Previous week / month sweeps
Shifts with sweep context
Drawing
Wall length: To last candle or Until its hunt session ends.
Days to keep: 5.
Label date format: HH:mm MM/dd.
Text: colour and size.
Aging: levels stay fresh for the first 5 trading days, then switch to the aged colour.
Use it on an intraday chart; 1–5 minutes is recommended. Session walls and shifts only draw on 30 minutes or lower. The day, week and month levels come from daily data, so they stay accurate even when your chart only loads a few days.
Honest notes
I tested this on NQ 1-minute data (2018, 2022–2026). The rules were fixed first, built on 2018–24, then checked once on 2025–26.
Walls get hunted a lot. London takes the Asia high on about 58% of days, and NY AM takes at least one London wall on most days.
A shift on its own does not call direction. None of the four shift types held up in both periods.
The cue that held: after a London REVERSAL, price reached the other Asia wall by 11:00 about 65% of the time, against 54% after any sweep. That’s a target cue, not an entry.
Use Kekkai to read the hunt, not to replace your execution. Not financial advice. Do your own testing.
Stay patient, stay hungry, and never stop believing in the work you’re putting in. The market rewards the ones who keep showing up.
— Unclehk2000
This is a confluence map, not a signal. Use it next to your own model. It’s open source, so take it, test it, break it and build on it.
If you’re still here, still studying, still showing up after the losing days, you’re already ahead of most people who started with you. Nobody hands you consistency. You build it one session at a time. Back yourself. Your edge comes from the reps nobody sees, so keep going.
How it works
Kekkai treats the trading day as a chain. Each session builds walls for the next one, and the next one hunts them.
Session (ET) Role
Asia 20:00–00:00 Builds London’s walls
London 02:00–05:00 Hunts the Asia high and low
NY AM 09:30–11:00 Hunts the London high and low
NY Lunch 11:30–13:00 Builds NY PM’s walls
NY PM 13:30–16:00 Hunts the Lunch high and low
It also draws the higher-timeframe walls on top: PDH/PDL, each day’s high and low this week, and the week and month high and low to date.
What you see
Walls: each session’s high and low, starting at the candle that printed it and running to the last candle. Labels sit on the right with the time and date the wall formed.
Sweeps: when the hunting session trades through a wall, it gets marked (e.g. “Asia H swept 02:47”) and the wall turns dashed.
Shifts: two consecutive 30-minute blocks printing higher highs and higher lows (▲), or lower lows and lower highs (▼), inside London, NY AM or NY PM. Each shift is labelled with what happened to the walls before it:
REVERSAL: one wall hunted, then price shifts away from it (hunt, then kill)
continuation: a wall swept, then price keeps going through it
both walls hunted
no sweep
The label also says whether PDH or PDL has already been taken that day.
Compression: a session is tagged “compressed” when its range is under 75% of its own 20-session average. The prior day gets “compressed day” on the same rule.
Higher-timeframe walls:
PDH / PDL
Each completed day’s high and low this week (Mon H, Tue L…)
Today’s high and low so far (dotted)
Week and month high/low to date (dotted, moving as new extremes print)
Previous week and month high/low (optional)
Day-of-week labels along the bottom.
Age colouring: drawings older than 5 trading days turn grey, so fresh levels stand out.
Settings
Sessions (ET)
Asia, London, NY AM, NY Lunch, NY PM: all fully adjustable.
Shift block length: 30 minutes. The last block is checked at the session close, so a 90-minute NY AM can only confirm a shift at 11:00.
Session walls
Show/hide and colour for the Asia, London and Lunch walls.
Wall midpoints: off by default.
Compression: average length 20, threshold 75%.
Day · Week · Month (exchange day, 18:00 ET start)
PDH / PDL
Each day’s high / low this week
Today’s high / low so far
Week high / low to date
Month high / low to date
Previous week / month high / low (off by default)
Line width
Day-of-week labels
Sweeps & shifts
Session-wall sweeps
PDH / PDL sweeps
Earlier-day sweeps (off by default)
Previous week / month sweeps
Shifts with sweep context
Drawing
Wall length: To last candle or Until its hunt session ends.
Days to keep: 5.
Label date format: HH:mm MM/dd.
Text: colour and size.
Aging: levels stay fresh for the first 5 trading days, then switch to the aged colour.
Use it on an intraday chart; 1–5 minutes is recommended. Session walls and shifts only draw on 30 minutes or lower. The day, week and month levels come from daily data, so they stay accurate even when your chart only loads a few days.
Honest notes
I tested this on NQ 1-minute data (2018, 2022–2026). The rules were fixed first, built on 2018–24, then checked once on 2025–26.
Walls get hunted a lot. London takes the Asia high on about 58% of days, and NY AM takes at least one London wall on most days.
A shift on its own does not call direction. None of the four shift types held up in both periods.
The cue that held: after a London REVERSAL, price reached the other Asia wall by 11:00 about 65% of the time, against 54% after any sweep. That’s a target cue, not an entry.
Use Kekkai to read the hunt, not to replace your execution. Not financial advice. Do your own testing.
Stay patient, stay hungry, and never stop believing in the work you’re putting in. The market rewards the ones who keep showing up.
— Unclehk2000
Release Notes
• Settings:– the Drawing section is now View, at the top: Theme, Text size, Text colour, label date format, days to keep and how older days fade;
– section names are plain, as in the newer indicators.
• Theme: Auto follows the chart background. Text, and every colour that used to default to black, now reads on dark charts as well as light: Picking any colour still overrides the theme.
• The settings values no longer fill the status line next to the indicator's name.
Release Notes
Kekkai Barrier v2: session boxes and price delivery.• Shaded session boxes for Asia, London, NY AM, Lunch and NY PM, each labelled with its price-delivery state: expansion, reversal, retracement or consolidation, read against the session before it.
• Walls (each session's high / low) now run until taken by default, labelled ASIA High, LNDN Low and so on; NY AM and NY PM get walls too. "To last candle" and "until its hunt session ends" stay as options.
• PD mid joins PDH / PDL. The week / month / day-of-week lines are now off by default (all still in settings).
• A session card: range (shaded when at or above its 20-session average), state, and the odds the next session takes each session's high and low, with ✓ once taken. Rows for PD and today, and a READ line.
• Layout: Desktop / Mobile.
• Tested on NQ + ES + RTY 1-minute, 2018–26, 6,124 days; each figure held in 2018–24, 2025–26 and on each symbol.

Disclaimer
The information and publications are not meant to be, and do not constitute, financial, investment, trading, or other types of advice or recommendations supplied or endorsed by TradingView. Read more in the Terms of Use.
Disclaimer
The information and publications are not meant to be, and do not constitute, financial, investment, trading, or other types of advice or recommendations supplied or endorsed by TradingView. Read more in the Terms of Use.