OPEN-SOURCE SCRIPT
Updated MTF Range Tracker+ (M1D)
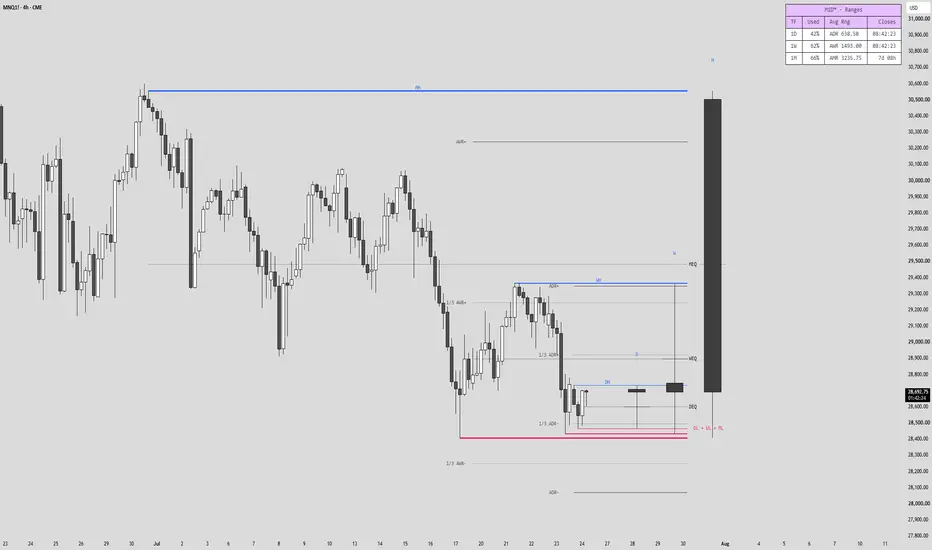
OVERVIEW
MTF Range Tracker+ draws the Daily, Weekly and Monthly trading ranges as clean, connected boxes directly on your chart, then projects each range's High, Low and Equilibrium into a compact Power-of-Three (PO3) candle stack on the right. It adds Average Daily / Weekly / Monthly Range levels (ADR / AWR / AMR) and a small dashboard that tells you, at a glance, how much of each average range the current period has already used.
It is a top-down, time-based framework tool. Instead of hunting individual signals, it lays out the higher-timeframe structure — where price is inside its daily, weekly and monthly range (premium vs discount), how much room is statistically left, and which levels are acting as liquidity or as a magnet — so you can build a bias and plan trades around it.
Everything is drawn on bar close and completed ranges do not repaint.
WHAT IT PLOTS
KEY DEFINITIONS
HOW TO USE IT
Monthly bias (the widest context)
Weekly bias (the swing context)
Daily bias and trade planning (the execution context)
Reading the PO3 stack
Glance at the daily PO3 candles for the recent daily rhythm (expansion vs consolidation, up-closes vs down-closes) and at the weekly / monthly candle for the dominant higher-timeframe direction — all without switching charts.
A simple top-down routine
SETTINGS
HOW IT IS CALCULATED (and repainting)
NOTES & DISCLAIMER
This indicator is an analytical and planning tool. It does not generate buy/sell signals, does not predict future price, and makes no representation about trading performance. Average-range statistics describe typical past behavior and can be exceeded or undershot at any time. Nothing here is financial advice — always do your own analysis and manage risk. Use it as one input in your own process.
MTF Range Tracker+ draws the Daily, Weekly and Monthly trading ranges as clean, connected boxes directly on your chart, then projects each range's High, Low and Equilibrium into a compact Power-of-Three (PO3) candle stack on the right. It adds Average Daily / Weekly / Monthly Range levels (ADR / AWR / AMR) and a small dashboard that tells you, at a glance, how much of each average range the current period has already used.
It is a top-down, time-based framework tool. Instead of hunting individual signals, it lays out the higher-timeframe structure — where price is inside its daily, weekly and monthly range (premium vs discount), how much room is statistically left, and which levels are acting as liquidity or as a magnet — so you can build a bias and plan trades around it.
Everything is drawn on bar close and completed ranges do not repaint.
WHAT IT PLOTS
- Period range boxes (Daily / Weekly / Monthly) — each completed period is boxed from its high to its low across its own bars. Consecutive periods share their vertical dividers, so a run of days (or weeks, or months) reads as one connected structure rather than separate rectangles. The current, still-forming period is drawn live and left open on the right so it visibly flows into the projection.
- Range projection to the PO3 candles — the window High and window Low (the highest high and lowest low across the periods currently shown) are drawn from the exact origin candle where each extreme formed, straight across to a compact PO3 candle that represents the range.
- PO3 candle stack — each displayed period is also rendered as one compact candle to the right of price, grouped by timeframe (Daily, then Weekly, then Monthly) — a fast higher-timeframe read without leaving your execution chart.
- ADR / AWR / AMR levels — the Average Daily, Weekly and Monthly Range is projected from the current period's open as +/- the full average, with optional +/- 1/3 levels.
- Dashboard (M1D™) — a small monospace table showing, per timeframe, the percentage of the average range already used this period and the average range itself in points.
KEY DEFINITIONS
- Equilibrium (EQ) — the 50% level of a range. Above EQ is a PREMIUM (relatively expensive) area; below EQ is a DISCOUNT (relatively cheap) area. This premium/discount read is the backbone of building bias.
- ADR / AWR / AMR (Average Daily / Weekly / Monthly Range) — the average of the last N completed period ranges (high minus low). ADR answers "how far does this market usually travel in a day?" AWR and AMR answer the same for a week and a month. Lengths are adjustable.
- Used % (dashboard) — how far the current period has already travelled relative to its average range: (this period's high − low) / average range × 100. Example: "1D 58%" means today has already covered 58% of a typical daily range. A low reading means the period still has room to expand; near or over 100% means it's already extended for its type, and the value turns to the Low colour past 100% as a visual flag.
HOW TO USE IT
Monthly bias (the widest context)
- Is price in the monthly PREMIUM (above MEQ) or DISCOUNT (below MEQ)? That frames whether you are, broadly, looking to sell rallies or buy dips within the monthly range.
- MH and ML are the monthly liquidity extremes — obvious targets and obvious places for stops to rest.
- The monthly Used % tells you whether the month is early (room to run) or already stretched.
Weekly bias (the swing context)
- Same premium/discount logic against WEQ. A weekly discount that aligns with a monthly discount is a stronger location to look for longs, and vice-versa.
- WH / WL frame the week's liquidity; AWR frames how much more the week can reasonably travel.
Daily bias and trade planning (the execution context)
- Use the previous day's DH / DL as liquidity references and DEQ as a common draw / target.
- Use ADR to plan realistic targets: if only ~40% of the ADR is used and price is in discount below DEQ, a move back toward DEQ or the ADR+ level is a measured objective. If ~90% of the ADR is already used, expectations for further same-direction travel should be lower.
- The +/- 1/3 ADR levels give intraday interim objectives and areas where extended moves often pause.
Reading the PO3 stack
Glance at the daily PO3 candles for the recent daily rhythm (expansion vs consolidation, up-closes vs down-closes) and at the weekly / monthly candle for the dominant higher-timeframe direction — all without switching charts.
A simple top-down routine
- Monthly: note premium/discount and month range used.
- Weekly: note premium/discount and where price sits vs WH / WL.
- Daily: check ADR used and whether price is reaching for DH / DL or drawing back to DEQ.
- Drop to your execution timeframe and take entries only in the direction and location the higher-timeframe ranges support.
SETTINGS
- Ranges — toggle Daily / Weekly / Monthly and set how many completed periods to show (Days 1–10, Weeks 1–3, Months 1–2). The forming period always draws.
- Range Style — box outline, High / Low / EQ colours (blue high / red low by default; set both to black for a fully neutral chart), and whether to connect the ranges to the PO3 candles.
- PO3 Candles — show/hide, offset, width, spacing, wick width, per-cluster timeframe tag, EQ tick, and the bull/bear body / border / wick colours.
- Average Ranges — enable ADR / AWR / AMR lines, set each averaging length, and toggle the 1/3 levels.
- Dashboard — show/hide, position, text size.
- Text — compact labels and independent size controls for the per-box and the projection / average labels.
HOW IT IS CALCULATED (and repainting)
- Period ranges are captured natively from the chart: on each Daily / Weekly / Monthly rollover the completed period's high, low, open and the bars where its high and low printed are stored, then a new period starts. Completed boxes are fixed and do not repaint.
- The weekly period is anchored to the weekend reopen (the Sunday session), so a single mid-week market holiday will not split a week into two; daily and monthly periods roll on their normal calendar boundaries.
- ADR / AWR / AMR use confirmed higher-timeframe values (previous completed bar), the standard non-repainting approach.
- Because monthly and weekly boxes need enough chart history to cover those periods, run the tool on an intraday-to-daily timeframe with sufficient loaded history (best on 15-minute charts and higher).
NOTES & DISCLAIMER
This indicator is an analytical and planning tool. It does not generate buy/sell signals, does not predict future price, and makes no representation about trading performance. Average-range statistics describe typical past behavior and can be exceeded or undershot at any time. Nothing here is financial advice — always do your own analysis and manage risk. Use it as one input in your own process.
Release Notes
Update — fixed a low-timeframe errorFixed a compile-time error ("Bar index value... is too far from the current bar index") that could occur on low chart timeframes (e.g. 1-minute) once enough history had loaded, affecting the Weekly / Monthly (and potentially Daily) ranges.
- Root cause: range boxes and their connecting lines were anchored to a bar count, which has a hard distance limit from the current bar. On a 1-minute chart, a week or month of bars can exceed that limit.
- Fix: these elements are now anchored to time instead, which has no such limit — they behave identically, just without the crash risk on low timeframes.
- No visual or behavioural changes. Existing settings, colours, and layout are unaffected.
Release Notes
Update — fixes and improvementsFIXES-
· Weekly ranges now roll correctly on 24/7 markets (crypto). Previously the weekly range and its candle only rolled on gapped markets, so on continuous symbols the forming week never reset and stretched across the chart.
· Average ranges in the dashboard now display at the symbol's full precision. On sub-1.0 / low-tick symbols (e.g. FX) ADR / AWR / AMR no longer round down to "0".
IMPROVEMENTS-
· Shared levels merge into one label. When the day, week and month sit on the same high (or low, or equilibrium), the labels combine — e.g. "DH + WH + MH" — instead of stacking on top of each other. Applies to both the box labels and the window High / Low end labels.
· Dashboard colours are now fully adjustable: separate controls for text, header tint, background and frame. Defaults are unchanged, so the look is the same until you set them.
Release Notes
Update — nested ranges, per-timeframe styling, close countdownsRange rendering
• New "Nested levels" style (now default): each timeframe's current range draws as clean horizontal High / Equilibrium / Low lines. Because today sits inside this week which sits inside this month, the highs stack Monthly → Weekly → Daily from the outside in and the lows mirror it — the range compresses inward, Monthly always the widest. High and Low lines begin at the candle that formed each extreme.
• The original outlined-box look is kept as a "Chained boxes" style option.
• Per-timeframe line width — Daily / Weekly / Monthly default 1 / 2 / 3, so the wider the timeframe the heavier the line.
Prior periods
• Each timeframe's "back" count now goes down to 0, to show only the current forming range.
• Prior day / week / month ranges draw as light context levels over their own span, with an adjustable fade.
Labels
• The current (active) range is labelled at the right edge; prior-period levels are labelled centred on their span.
• Grouped placement controls — Highs, Lows, Equilibriums and Averages each have their own Side (Right / Left / Origin / Center / Off) and a fine nudge. Levels sharing a price merge into one label, e.g. WH + DH when today's high is also the week's high.
Dashboard
• Added a live close-countdown column — time remaining to each period's close (HH:MM:SS, or Xd HHh when over a day out).
• Optional equilibrium (50%) levels toggle.
Method is unchanged: completed periods are captured natively on rollover and never repaint; only the still-forming range updates live. Averages and the countdowns use confirmed higher-timeframe data.
Open-source script
In true TradingView spirit, the creator of this script has made it open-source, so that traders can review and verify its functionality. Kudos to the author! While you can use it for free, remember that republishing the code is subject to our House Rules.

Disclaimer
The information and publications are not meant to be, and do not constitute, financial, investment, trading, or other types of advice or recommendations supplied or endorsed by TradingView. Read more in the Terms of Use.
Open-source script
In true TradingView spirit, the creator of this script has made it open-source, so that traders can review and verify its functionality. Kudos to the author! While you can use it for free, remember that republishing the code is subject to our House Rules.
Disclaimer
The information and publications are not meant to be, and do not constitute, financial, investment, trading, or other types of advice or recommendations supplied or endorsed by TradingView. Read more in the Terms of Use.