OPEN-SOURCE SCRIPT
Updated The Break
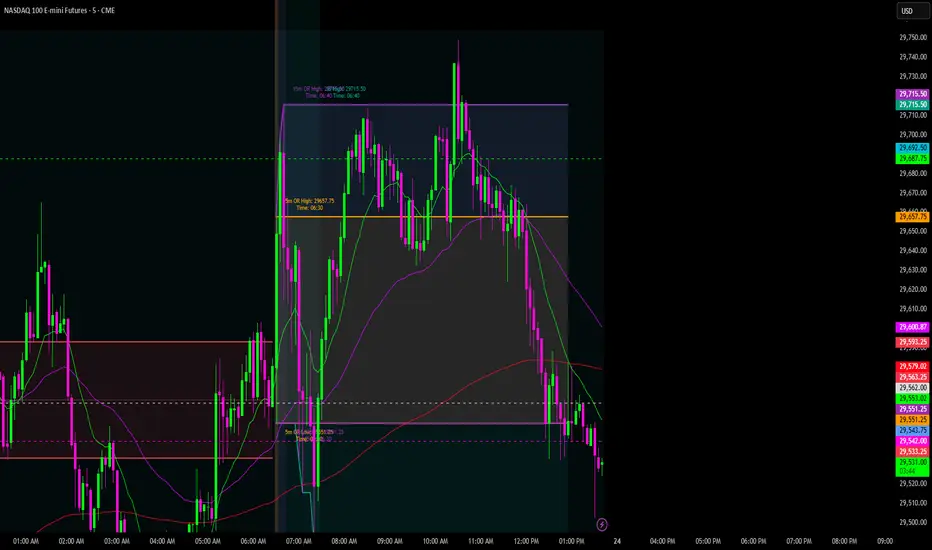
A multi-session Initial Balance indicator that maps the day's most-watched ranges onto a single chart. It tracks the first 60 minutes of every major session — Asia, London, and New York — independently, and locks in each one's high, low, and equilibrium the instant the IB window closes.
During the build window, a shaded box grows bar-by-bar so you can watch the range develop in real time. The moment the IB completes, the box freezes, and three lines extend across the rest of the session: IB High, IB Mid, and IB Low. Each session gets its own color, so all three IBs read cleanly on one chart without overlap confusion.
This indicator does one thing and does it cleanly: it draws the ranges. No signals, no entries, no targets — just the structural map you need to see where each session sets its open balance, and where price is trading relative to those levels right now.
A status dashboard in the top-right corner tracks each session's IB state at a glance: building / locked / above/inside / below, plus current price relative to the range and time remaining in the window.
All session times are anchored to a single time zone setting (ET / PT / chart-local), so windows stay correct across futures, FX, and crypto symbols, and the indicator uses extended-hours data. Hence, the Asia and London ranges plot correctly even on RTH-only charts.
Use it for: defining session bias before NY open, marking IB extremes as magnet levels and reaction zones, identifying which session is leading the day, and giving any breakout or reversal strategy a clean structural reference to work from.
Default Sessions (ET)
Asia IB — 18:00–19:00 (Sun–Thu)
London IB — 02:00–03:00
New York IB — 09:30–10:30
Every session window and IB duration is fully editable. Run a 30-minute IB instead, shift NY to your prop firm's window, or turn off any session you don't trade.
Settings to Know
IB duration — 1–240 min (default 60)
Timezone — ET / PT / chart-local
Session colors — independent for Asia / London / NY ranges and lines
Midlinee — toggle equilibrium on/off; solid or dashed
Range box — toggle live build window on/off; adjust transparency
Extend lines — to session end, to next IB start, or full chart.
Dashboard — Small / Medium / Large, or hide entirely
Notes
Built with extended-hours data fetching so Asia and London ranges plot correctly on both ETH and RTH-only charts.
Works on any TradingView symbol; defaults are tuned for NQ, but every input is editable.
Plots are non-repainting — once the IB window closes, the levels are locked.
During the build window, a shaded box grows bar-by-bar so you can watch the range develop in real time. The moment the IB completes, the box freezes, and three lines extend across the rest of the session: IB High, IB Mid, and IB Low. Each session gets its own color, so all three IBs read cleanly on one chart without overlap confusion.
This indicator does one thing and does it cleanly: it draws the ranges. No signals, no entries, no targets — just the structural map you need to see where each session sets its open balance, and where price is trading relative to those levels right now.
A status dashboard in the top-right corner tracks each session's IB state at a glance: building / locked / above/inside / below, plus current price relative to the range and time remaining in the window.
All session times are anchored to a single time zone setting (ET / PT / chart-local), so windows stay correct across futures, FX, and crypto symbols, and the indicator uses extended-hours data. Hence, the Asia and London ranges plot correctly even on RTH-only charts.
Use it for: defining session bias before NY open, marking IB extremes as magnet levels and reaction zones, identifying which session is leading the day, and giving any breakout or reversal strategy a clean structural reference to work from.
Default Sessions (ET)
Asia IB — 18:00–19:00 (Sun–Thu)
London IB — 02:00–03:00
New York IB — 09:30–10:30
Every session window and IB duration is fully editable. Run a 30-minute IB instead, shift NY to your prop firm's window, or turn off any session you don't trade.
Settings to Know
IB duration — 1–240 min (default 60)
Timezone — ET / PT / chart-local
Session colors — independent for Asia / London / NY ranges and lines
Midlinee — toggle equilibrium on/off; solid or dashed
Range box — toggle live build window on/off; adjust transparency
Extend lines — to session end, to next IB start, or full chart.
Dashboard — Small / Medium / Large, or hide entirely
Notes
Built with extended-hours data fetching so Asia and London ranges plot correctly on both ETH and RTH-only charts.
Works on any TradingView symbol; defaults are tuned for NQ, but every input is editable.
Plots are non-repainting — once the IB window closes, the levels are locked.
Release Notes
This update adds two new levels on top of the existing New York / Asia / London Initial Balance framework: a 5-minute opening range and a 15-minute opening range, measured from the open of a configurable anchor session (default: New York cash open, 09:30–16:00).What's new
5-Min Opening Range — high, low, and midpoint of the first 5 minutes after the anchor session opens.
15-Min Opening Range — high, low, and midpoint of the first 15 minutes after the anchor session opens.
Dedicated "Opening Range" settings group with independent enable toggles and color pickers for each range, plus a shared anchor-session input so you can point both ranges at any session (NY cash, futures RTH, FX London open, etc.).
Full visual treatment matching the existing IB sessions: solid high/low lines, faded midpoint line, translucent range fill, and a background highlight over the formation window.
End-of-window labels showing the locked high/low price and the time each was set, formatted in your chosen 12H or 24H format.
How it works
Both ranges reuse the same Initial Balance engine the rest of the script is built on — they're effectively short-duration IBs anchored to the same session. The range tracks live during its formation window, locks in once the window closes, and then displays as static reference levels through the rest of the anchor session.
Recommended use
For accurate range capture, run the chart at 5-minute timeframe or lower for the 5-min range, and 15-minute or lower for the 15-min range. On higher timeframes the range will collapse to the opening bar's high/low.
Defaults
Anchor session: 09:30–16:00 (New York cash)
5-min range color: orange
15-min range color: purple
All other existing inputs unchanged
Unchanged behavior
The New York, Asia, and London IB calculations, plots, fills, period highlights, and labels are identical to the previous version. Existing chart setups will load without any change in appearance for those levels.
Open-source script
In true TradingView spirit, the creator of this script has made it open-source, so that traders can review and verify its functionality. Kudos to the author! While you can use it for free, remember that republishing the code is subject to our House Rules.

Disclaimer
The information and publications are not meant to be, and do not constitute, financial, investment, trading, or other types of advice or recommendations supplied or endorsed by TradingView. Read more in the Terms of Use.
Open-source script
In true TradingView spirit, the creator of this script has made it open-source, so that traders can review and verify its functionality. Kudos to the author! While you can use it for free, remember that republishing the code is subject to our House Rules.
Disclaimer
The information and publications are not meant to be, and do not constitute, financial, investment, trading, or other types of advice or recommendations supplied or endorsed by TradingView. Read more in the Terms of Use.