OPEN-SOURCE SCRIPT
Updated Oversold Master
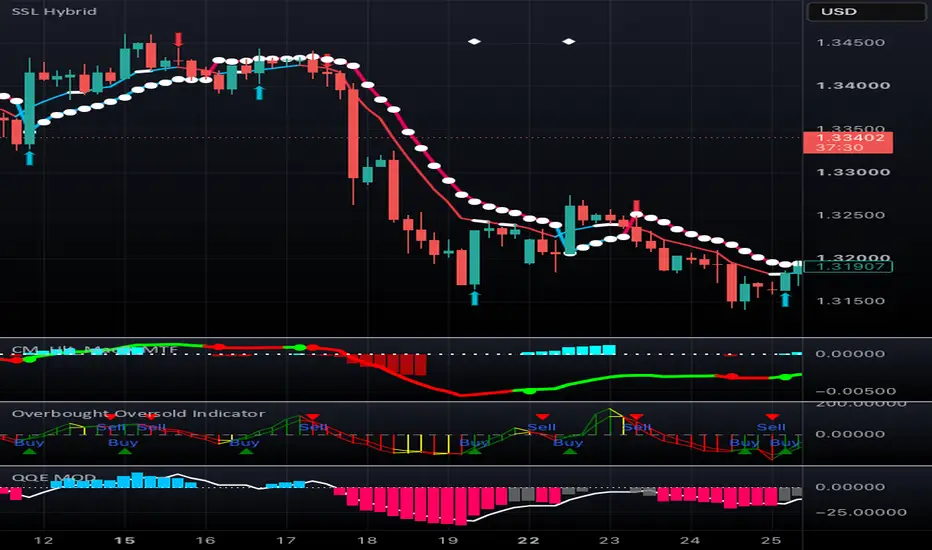
How it works, and how to tune it:
Gray line = neutral. Red = in overbought zone. Blue = in oversold zone.
A triangle signal only appears after price has confirmed its way back out of the zone (controlled by "Bars to Confirm Exit From Zone") — this is what prevents you from selling into a strong momentum spike that keeps climbing.
The bands themselves move (adaptive mode) — during high volatility they widen, so you don't get an overbought signal every 20 minutes; during quiet chop they tighten, so you still catch real extremes.
The trend filter checks a daily EMA by default — it will block sell signals while the daily trend is up, and block buy signals while the daily trend is down. This is the setting most responsible for avoiding "buying a dip that's actually the start of a crash."
Gray line = neutral. Red = in overbought zone. Blue = in oversold zone.
A triangle signal only appears after price has confirmed its way back out of the zone (controlled by "Bars to Confirm Exit From Zone") — this is what prevents you from selling into a strong momentum spike that keeps climbing.
The bands themselves move (adaptive mode) — during high volatility they widen, so you don't get an overbought signal every 20 minutes; during quiet chop they tighten, so you still catch real extremes.
The trend filter checks a daily EMA by default — it will block sell signals while the daily trend is up, and block buy signals while the daily trend is down. This is the setting most responsible for avoiding "buying a dip that's actually the start of a crash."
Release Notes
How it works, and how to tune it:Gray line = neutral. Red = in overbought zone. Blue = in oversold zone.
A triangle signal only appears after price has confirmed its way back out of the zone (controlled by "Bars to Confirm Exit From Zone") — this is what prevents you from selling into a strong momentum spike that keeps climbing.
The bands themselves move (adaptive mode) — during high volatility they widen, so you don't get an overbought signal every 20 minutes; during quiet chop they tighten, so you still catch real extremes.
The trend filter checks a daily EMA by default — it will block sell signals while the daily trend is up, and block buy signals while the daily trend is down. This is the setting most responsible for avoiding "buying a dip that's actually the start of a crash."
Open-source script
In true TradingView spirit, the creator of this script has made it open-source, so that traders can review and verify its functionality. Kudos to the author! While you can use it for free, remember that republishing the code is subject to our House Rules.

Disclaimer
The information and publications are not meant to be, and do not constitute, financial, investment, trading, or other types of advice or recommendations supplied or endorsed by TradingView. Read more in the Terms of Use.
Open-source script
In true TradingView spirit, the creator of this script has made it open-source, so that traders can review and verify its functionality. Kudos to the author! While you can use it for free, remember that republishing the code is subject to our House Rules.
Disclaimer
The information and publications are not meant to be, and do not constitute, financial, investment, trading, or other types of advice or recommendations supplied or endorsed by TradingView. Read more in the Terms of Use.