Options Strike Probability Map [Strikeline]
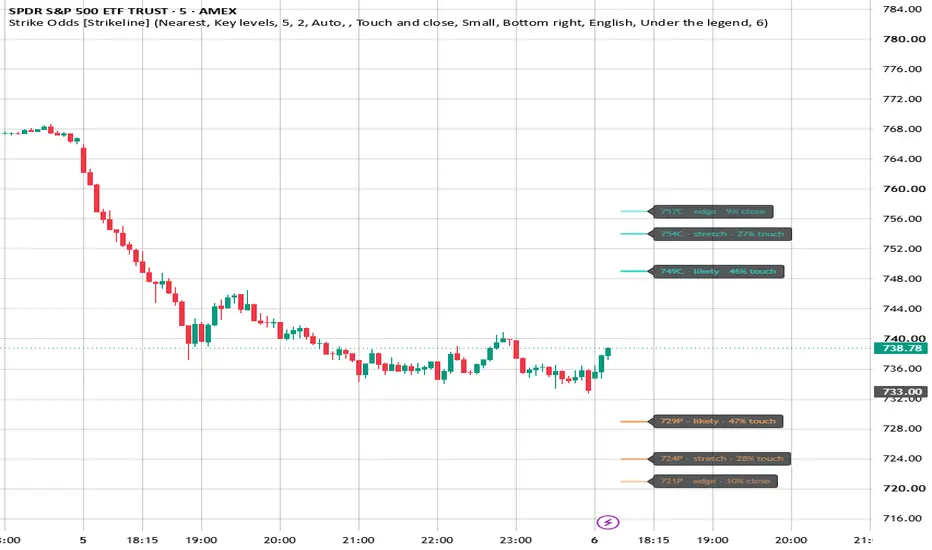
Options Strike Probability Map shows, for each strike around price, the chance the options market is pricing that price reaches it, or finishes beyond it, before the contract expires.
WORKS ON
Optionable US stocks and ETFs, and SPX. SPY, QQQ, IWM and SPX use today's contracts (daily expirations). AAPL, MSFT, NVDA, TSLA, AMZN, META, GOOGL, AVGO, AMD, MU, INTC, IBIT, XLF and SMH use the next Monday, Wednesday or Friday contract. Other stocks use this Friday. Use an intraday chart (2m to 15m).
WHAT IT DRAWS
Three key strikes above price (calls) and three below (puts), each with its role and the one number that matters for it:
• Likely: about a 50% chance price touches it before expiration. For example "745C · likely · 48% touch".
• Stretch: about a 1-in-3 chance to touch. Reached on stronger days.
• Edge: the first strike with under 10% chance to finish in the money. Contracts beyond it are cheap for a reason.
Touch is the chance price trades at the strike at least once before expiration. Close is the chance it finishes beyond it, i.e. the option ends in the money.
• Optional: every listed strike with both numbers ("All strikes" in the settings).
• Optional, off by default: a one-line reading in plain words (English, Arabic, Spanish or Turkish).
• An optional dashboard (off by default) with the volatility source and the move priced in until expiration.
HOW IT WORKS
• Volatility comes from the at-the-money straddle (call + put at the strike nearest to price): straddle ≈ 0.8 × price × σ√T, so the straddle alone gives the move priced in until expiration.
• If option prices are missing, it falls back to the volatility index (VIX1D for SPY/SPX, VXN for QQQ, RVX for IWM, VIX for the rest) or the stock's 20-day historical volatility.
• Close beyond: lognormal probability, no drift. Touch: about twice the close-beyond chance (reflection principle).
• No inputs to set: strikes, expiration and volatility are picked automatically.
KEEP IN MIND
• These are the market's prices turned into odds, not a forecast. Real moves have fatter tails than the model.
• Free option data on TradingView runs about 15–20 minutes behind; the dashboard shows the time the data reaches.
• Educational tool. Not financial advice. No performance is implied.
Open source (MPL 2.0). Part of the Strikeline options toolkit.
WORKS ON
Optionable US stocks and ETFs, and SPX. SPY, QQQ, IWM and SPX use today's contracts (daily expirations). AAPL, MSFT, NVDA, TSLA, AMZN, META, GOOGL, AVGO, AMD, MU, INTC, IBIT, XLF and SMH use the next Monday, Wednesday or Friday contract. Other stocks use this Friday. Use an intraday chart (2m to 15m).
WHAT IT DRAWS
Three key strikes above price (calls) and three below (puts), each with its role and the one number that matters for it:
• Likely: about a 50% chance price touches it before expiration. For example "745C · likely · 48% touch".
• Stretch: about a 1-in-3 chance to touch. Reached on stronger days.
• Edge: the first strike with under 10% chance to finish in the money. Contracts beyond it are cheap for a reason.
Touch is the chance price trades at the strike at least once before expiration. Close is the chance it finishes beyond it, i.e. the option ends in the money.
• Optional: every listed strike with both numbers ("All strikes" in the settings).
• Optional, off by default: a one-line reading in plain words (English, Arabic, Spanish or Turkish).
• An optional dashboard (off by default) with the volatility source and the move priced in until expiration.
HOW IT WORKS
• Volatility comes from the at-the-money straddle (call + put at the strike nearest to price): straddle ≈ 0.8 × price × σ√T, so the straddle alone gives the move priced in until expiration.
• If option prices are missing, it falls back to the volatility index (VIX1D for SPY/SPX, VXN for QQQ, RVX for IWM, VIX for the rest) or the stock's 20-day historical volatility.
• Close beyond: lognormal probability, no drift. Touch: about twice the close-beyond chance (reflection principle).
• No inputs to set: strikes, expiration and volatility are picked automatically.
KEEP IN MIND
• These are the market's prices turned into odds, not a forecast. Real moves have fatter tails than the model.
• Free option data on TradingView runs about 15–20 minutes behind; the dashboard shows the time the data reaches.
• Educational tool. Not financial advice. No performance is implied.
Open source (MPL 2.0). Part of the Strikeline options toolkit.

Disclaimer
The information and publications are not meant to be, and do not constitute, financial, investment, trading, or other types of advice or recommendations supplied or endorsed by TradingView. Read more in the Terms of Use.
Disclaimer
The information and publications are not meant to be, and do not constitute, financial, investment, trading, or other types of advice or recommendations supplied or endorsed by TradingView. Read more in the Terms of Use.