OPEN-SOURCE SCRIPT
Updated Breakout Confluence Score
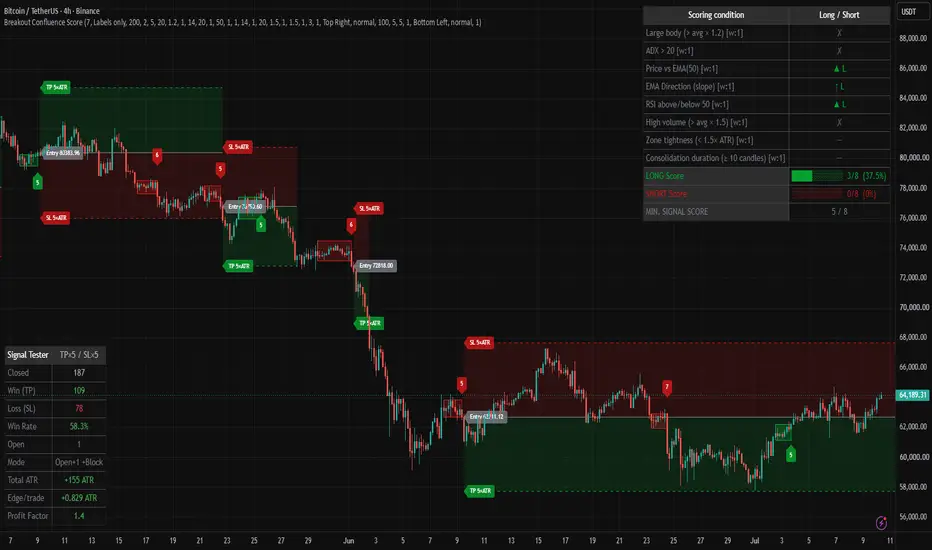
█ OVERVIEW
Breakout Confluence Score is an indicator designed to filter breakouts from consolidation by evaluating the overall market context before generating a signal.
The core assumption of the indicator is that not every breakout from consolidation has the same value. In practice, the success rate of a breakout depends on many independent factors such as market direction, trend strength, momentum, participant activity, and the quality of the consolidation itself.
Instead of treating every breakout equally, the indicator analyzes a series of independent market elements and assigns each of them a specific number of points. The final result creates the so-called Confluence Score — an assessment of how well multiple factors support a given breakout.
Only after reaching the minimum required score is a LONG or SHORT signal generated.
This approach significantly reduces the number of weak breakouts that appear during choppy price action, while still offering full configuration flexibility. Every scoring element can be individually enabled, disabled, or assigned its own point weight.
In addition to generating signals, the indicator also serves as a tool for ongoing market evaluation. The built-in scoring table shows the current status of all conditions even before a breakout occurs, allowing the trader to observe whether market conditions are gradually improving or deteriorating.
An integral part of the indicator is also the Signal Tester, which enables quick evaluation of the historical performance of the signals without the need to create a separate TradingView strategy. The tester was designed as a tool for assessing signal quality rather than as a full backtesting engine. This allows it to offer several capabilities that are difficult or impossible to achieve in classic strategies.
All modules of the indicator can operate independently, which means Breakout Confluence Score can be used as a simple breakout detector, a consolidation analysis tool, a market condition evaluation system, or a complete trade signal filter.
█ CONCEPTS
Most breakout indicators assume that every breakout from consolidation has similar chances of success.
In reality, the market does not work that way.
Price constantly moves through phases of trend, accumulation, distribution, and choppy movements without a clear direction. Two almost identical-looking breakouts can lead to completely different outcomes solely because of different market conditions.
That is why Breakout Confluence Score separates the signal generation process into two independent stages:
• detection of the breakout,
• evaluation of the quality of market conditions supporting that breakout.
A signal appears only when both conditions are met.
Building Consolidation and Boxes
The foundation of the indicator is automatic consolidation detection.
Consolidation begins when a defined number of consecutive candles remain inside the High-Low range of the base candle. The first candle that meets this condition defines the boundaries of the entire consolidation zone.
Its high becomes the upper boundary of the box, while its low defines the lower boundary. As long as every subsequent candle stays inside this range, the consolidation continues and the box is gradually extended to the right with each new candle.
As a result, a visual equilibrium zone appears on the chart, showing the area where neither buyers nor sellers have yet gained a clear advantage.
Consolidation ends in one of three cases:
• price breaks above the upper boundary of the box,
• price breaks below the lower boundary of the box,
• consolidation lasts too long and exceeds the maximum allowed number of candles.
Optionally, the indicator can also prevent a new consolidation from starting after a candle with an exceptionally large range. For this purpose, it uses ATR calculated before the analyzed candle, so a single large impulse cannot artificially inflate the volatility threshold and facilitate the creation of a new consolidation zone.
Why the Breakout Alone Is Not Enough
A breakout from consolidation does not automatically mean a good trading opportunity.
Very often breakouts occur:
• without clear momentum,
• against the dominant trend,
• on low volume,
• during a weak trend,
• without real buying or selling pressure.
Technically these are valid breakouts, but statistically their success rate tends to be much lower.
For this reason, the indicator does not evaluate only the fact of the breakout itself, but also the entire market environment in which it occurs. In practice, this means that two identical breakouts can receive completely different point scores. It is the scoring system that determines the quality of the signal.
Scoring and Market Context Evaluation
The purpose of scoring is to determine the current market situation as accurately as possible.
The breakout itself only informs that price has left the consolidation zone.
Scoring answers a much more important question:
“Does the market have sufficient conditions to continue the move after the breakout?”
Each scoring element analyzes a different aspect of market behavior.
Thanks to this, the final score is not based on a single indicator, but represents a combination of multiple independent sources of information.
EMA – Trend Direction
The Price vs EMA condition determines the dominant market direction.
If price is above the EMA, the LONG side receives an advantage.
If price is below the EMA, the SHORT side receives an advantage.
EMA is therefore responsible for identifying the dominant trend.
EMA Slope – Trend Development
The mere location of price relative to the EMA does not yet tell us whether the trend is developing actively.
That is why the slope of the average is also analyzed.
A rising EMA indicates a developing uptrend.
A falling EMA indicates a developing downtrend.
EMA Slope is responsible for assessing the quality and direction of trend development.
RSI – Momentum
RSI is used as a momentum indicator.
It is not used here to find overbought or oversold zones.
Its task is to assess which side of the market currently has greater strength.
RSI above 50 supports LONG signals.
RSI below 50 supports SHORT signals.
RSI is responsible for evaluating current market momentum.
ADX – Trend Strength
ADX measures the strength of the move regardless of its direction.
A high ADX value means the market is moving in a decisive and orderly manner.
A low ADX value indicates the lack of a clear advantage for either side.
ADX is responsible for assessing trend strength.
Volume – Market Participant Activity
Volume allows evaluation of whether increased participant activity stands behind the breakout.
Breakouts that occur on above-average volume are generally more reliable than breakouts that occur during low activity.
Volume is responsible for assessing market interest.
Body Size – Strength of the Breakout Candle
A large body of the breakout candle indicates a decisive advantage of one side of the market.
If the candle body is clearly larger than the average of recent candles, the breakout receives additional points.
Body Size is responsible for evaluating the strength of the breakout impulse itself.
Zone Tightness – Market Compression
Not all consolidations have the same value.
The narrower the box relative to the current ATR, the higher the probability that the market is in a compression phase preceding a stronger move.
Zone Tightness is responsible for assessing the quality and compression of the consolidation.
Duration Premium – Maturity of Consolidation
Longer consolidations often lead to more decisive breakouts.
Therefore, the indicator additionally rewards zones that have lasted for a sufficient amount of time.
Duration Premium is responsible for assessing the maturity of the consolidation.
Live Market Analysis
Scoring does not work only at the moment of breakout.
The scoring table analyzes all conditions in real time, even before a signal appears.
This allows the trader to observe how the market situation is changing and which side of the market is gradually gaining an advantage.
In practice, the indicator becomes not only a signal system, but also a tool for continuous evaluation of the current market environment.
Signal Tester
The Signal Tester was designed as a quick tool for evaluating the quality of generated signals.
It is not a full backtesting engine like TradingView Strategy and its results should not be treated as an accurate simulation of real trading.
A simplified operating model was deliberately used because it enables functionalities that are difficult or impossible to achieve in classic strategies.
The tester can simultaneously maintain multiple positions, manage LONG and SHORT trades independently, and — depending on the settings — allow simultaneous opening of positions in both directions. It can also block new entries until the previous position is closed or reject signals that appear too close to already open trades.
Each position receives its own Entry, Take Profit, and Stop Loss levels calculated based on ATR, which makes it possible to quickly compare different scoring configurations without building a full strategy.
The tester’s results are calculated conservatively.
If both the Take Profit and Stop Loss levels could have been reached during a single candle, the tester always assumes that the Stop Loss was hit.
Because the real sequence of price movements inside a single candle is unknown, this approach deliberately underestimates rather than overestimates the results. This effect becomes especially visible with small TP and SL distances, for example 0.5 ATR, where both levels can very often be reached within one candle. The smaller the TP and SL values relative to ATR, the more conservative the tester’s statistics will be.
The tester also does not account for commissions, spreads, or slippage. Therefore its results should be treated as a tool for comparing signal quality and optimizing indicator settings, not as an accurate simulation of real trading results.
█ FEATURES
Consolidation
* Minimum number of candles in consolidation – Minimum number of consecutive candles required to recognize a consolidation zone
* Show consolidation zones – Enables/disables drawing of consolidation boxes on the chart
* Show breakout signals – Enables/disables display of breakout signals (triangles and/or score labels)
* Remove box if breakout did NOT produce a signal (score < threshold) – Automatically removes the box if the breakout did not reach the minimum scoring threshold
* Display signals as – Choose signal display style: triangles only, labels only, or both
* Maximum number of candles in consolidation (0 = no limit) – Maximum duration of consolidation — after exceeding it the box is closed without generating a signal
Candle Size Filter
* Block consolidation start on oversized candle – Prevents starting consolidation after a candle with a very large range
* Max candle range (high-low) × ATR – Threshold for candle size (multiple of ATR calculated before the candle)
Scoring - General
* Minimum score for a signal (weighted sum) – Minimum required Confluence Score to generate a signal
Scoring - Candle Body
* Average body period – Period used to calculate average candle body size
* Signal body multiplier (body > avg × mult) – Multiplier for required body size of the breakout candle
* Condition weight: large body – Point weight of the large body condition
Scoring - ADX
* ADX — period (DMI) – Period of the ADX indicator
* ADX — minimum value – Minimum ADX value required to award a point
* Condition weight: ADX – Point weight of the ADX condition
Scoring - EMA
* EMA — period (trend) – Period of the EMA used for trend evaluation
* Condition weight: price vs EMA – Point weight of the price vs EMA condition
* Condition weight: EMA direction (slope) – Point weight of the EMA slope condition
Scoring - RSI
* RSI — period – Period of the RSI indicator
* Condition weight: RSI – Point weight of the RSI above/below 50 condition
Scoring - Volume
* Volume — average period – Period used to calculate average volume
* Volume — multiplier (vol > avg × mult) – Multiplier for required volume on breakout
* Condition weight: high volume – Point weight of the high volume condition
Scoring - Consolidation Structure
* Zone tightness: max (top-bottom)/ATR – Threshold for zone width relative to ATR (compression)
* Condition weight: zone tightness – Point weight of the zone tightness condition
* Premium: extra candles above minimum – Additional number of candles above minimum required for duration premium
* Condition weight: duration (premium) – Point weight of the duration premium condition
Table
* Table position – Position of the scoring table on the chart
* Table text size – Text size in the scoring table
Colors
* Bullish Color (Long) – Color used for LONG elements
* Bearish Color (Short) – Color used for SHORT elements
* Neutral Color – Color used for neutral elements / no signal
Signal Tester (TP/SL)
* Enable signal tester – Enable/disable the signal tester
* Tester — ATR period – ATR period used by the tester
* Tester — Take Profit × ATR – Take Profit distance in ATR multiples
* Tester — Stop Loss × ATR – Stop Loss distance in ATR multiples
* Block new signals while a position is open – Block new signals until the previous position is closed
* Block signals too close to an existing position – Filter for minimum distance between signals
* Min. distance between signals × ATR – Minimum distance (in ATR) between signals in the same direction
Signal Tester - Table
* Tester table position – Position of the tester statistics table
* Tester table text size – Text size in the tester statistics table
Signal Tester - TP/SL Visualization
* Show TP/SL levels on chart – Display Entry / TP / SL levels on the chart
* Level line width – Width of TP/SL level lines
* Show risk/reward zone fill – Fill color for risk and reward zones
█ APPLICATIONS
The main task of the indicator is to evaluate the quality of the breakout by analyzing the confluence of multiple independent market factors (trend direction and strength, momentum, volume, impulse strength, zone compression, and consolidation maturity). A LONG or SHORT signal is generated only when the total score exceeds the set threshold.
Thanks to this approach, the indicator effectively eliminates a large portion of weak and false breakouts that occur in low-confluence conditions.
The scoring table operates in real time — even before a signal is generated — and allows the trader to observe how a potential opportunity is gradually building up (or falling apart). This is especially useful for early detection of moments when the market begins to meet more and more conditions favorable for a breakout.
The built-in Signal Tester enables quick and convenient comparison of different scoring configurations without the need to write a separate strategy. It allows checking in just a few seconds how changing weights or thresholds affects the historical performance of the signals.
The indicator achieves the best results when used together with support and resistance zone analysis. For example, opening a long position directly under strong resistance is generally not advisable, while a long signal aligned with a support zone usually produces significantly better results. Similarly, short signals appearing near resistance tend to be more effective than those generated without reference to key levels.
The indicator works best when combined with support and resistance analysis.
█ NOTES
* Each of the eight scoring conditions can be independently enabled or disabled by setting its weight to 0.
* The scoring table shows the current market state in real time — it can be used even when signal generation is disabled.
* The Signal Tester operates in conservative mode: if both TP and SL could have been reached on the same candle, it always counts it as a loss. This approach deliberately underestimates results to provide a more realistic picture.
* The tester does not account for commissions, spreads, or slippage — it serves only for comparing signal quality and optimizing settings.
* All modules of the indicator (consolidation detection, scoring, table, tester, TP/SL visualization) can operate completely independently.
* Very long consolidations exceeding the “Maximum number of candles” limit are automatically closed without generating a signal to avoid outdated zones.
* The best results are achieved when the indicator is used together with support and resistance zone analysis. Long signals near support and short signals near resistance are generally significantly more effective.
Breakout Confluence Score is an indicator designed to filter breakouts from consolidation by evaluating the overall market context before generating a signal.
The core assumption of the indicator is that not every breakout from consolidation has the same value. In practice, the success rate of a breakout depends on many independent factors such as market direction, trend strength, momentum, participant activity, and the quality of the consolidation itself.
Instead of treating every breakout equally, the indicator analyzes a series of independent market elements and assigns each of them a specific number of points. The final result creates the so-called Confluence Score — an assessment of how well multiple factors support a given breakout.
Only after reaching the minimum required score is a LONG or SHORT signal generated.
This approach significantly reduces the number of weak breakouts that appear during choppy price action, while still offering full configuration flexibility. Every scoring element can be individually enabled, disabled, or assigned its own point weight.
In addition to generating signals, the indicator also serves as a tool for ongoing market evaluation. The built-in scoring table shows the current status of all conditions even before a breakout occurs, allowing the trader to observe whether market conditions are gradually improving or deteriorating.
An integral part of the indicator is also the Signal Tester, which enables quick evaluation of the historical performance of the signals without the need to create a separate TradingView strategy. The tester was designed as a tool for assessing signal quality rather than as a full backtesting engine. This allows it to offer several capabilities that are difficult or impossible to achieve in classic strategies.
All modules of the indicator can operate independently, which means Breakout Confluence Score can be used as a simple breakout detector, a consolidation analysis tool, a market condition evaluation system, or a complete trade signal filter.
█ CONCEPTS
Most breakout indicators assume that every breakout from consolidation has similar chances of success.
In reality, the market does not work that way.
Price constantly moves through phases of trend, accumulation, distribution, and choppy movements without a clear direction. Two almost identical-looking breakouts can lead to completely different outcomes solely because of different market conditions.
That is why Breakout Confluence Score separates the signal generation process into two independent stages:
• detection of the breakout,
• evaluation of the quality of market conditions supporting that breakout.
A signal appears only when both conditions are met.
Building Consolidation and Boxes
The foundation of the indicator is automatic consolidation detection.
Consolidation begins when a defined number of consecutive candles remain inside the High-Low range of the base candle. The first candle that meets this condition defines the boundaries of the entire consolidation zone.
Its high becomes the upper boundary of the box, while its low defines the lower boundary. As long as every subsequent candle stays inside this range, the consolidation continues and the box is gradually extended to the right with each new candle.
As a result, a visual equilibrium zone appears on the chart, showing the area where neither buyers nor sellers have yet gained a clear advantage.
Consolidation ends in one of three cases:
• price breaks above the upper boundary of the box,
• price breaks below the lower boundary of the box,
• consolidation lasts too long and exceeds the maximum allowed number of candles.
Optionally, the indicator can also prevent a new consolidation from starting after a candle with an exceptionally large range. For this purpose, it uses ATR calculated before the analyzed candle, so a single large impulse cannot artificially inflate the volatility threshold and facilitate the creation of a new consolidation zone.
Why the Breakout Alone Is Not Enough
A breakout from consolidation does not automatically mean a good trading opportunity.
Very often breakouts occur:
• without clear momentum,
• against the dominant trend,
• on low volume,
• during a weak trend,
• without real buying or selling pressure.
Technically these are valid breakouts, but statistically their success rate tends to be much lower.
For this reason, the indicator does not evaluate only the fact of the breakout itself, but also the entire market environment in which it occurs. In practice, this means that two identical breakouts can receive completely different point scores. It is the scoring system that determines the quality of the signal.
Scoring and Market Context Evaluation
The purpose of scoring is to determine the current market situation as accurately as possible.
The breakout itself only informs that price has left the consolidation zone.
Scoring answers a much more important question:
“Does the market have sufficient conditions to continue the move after the breakout?”
Each scoring element analyzes a different aspect of market behavior.
Thanks to this, the final score is not based on a single indicator, but represents a combination of multiple independent sources of information.
EMA – Trend Direction
The Price vs EMA condition determines the dominant market direction.
If price is above the EMA, the LONG side receives an advantage.
If price is below the EMA, the SHORT side receives an advantage.
EMA is therefore responsible for identifying the dominant trend.
EMA Slope – Trend Development
The mere location of price relative to the EMA does not yet tell us whether the trend is developing actively.
That is why the slope of the average is also analyzed.
A rising EMA indicates a developing uptrend.
A falling EMA indicates a developing downtrend.
EMA Slope is responsible for assessing the quality and direction of trend development.
RSI – Momentum
RSI is used as a momentum indicator.
It is not used here to find overbought or oversold zones.
Its task is to assess which side of the market currently has greater strength.
RSI above 50 supports LONG signals.
RSI below 50 supports SHORT signals.
RSI is responsible for evaluating current market momentum.
ADX – Trend Strength
ADX measures the strength of the move regardless of its direction.
A high ADX value means the market is moving in a decisive and orderly manner.
A low ADX value indicates the lack of a clear advantage for either side.
ADX is responsible for assessing trend strength.
Volume – Market Participant Activity
Volume allows evaluation of whether increased participant activity stands behind the breakout.
Breakouts that occur on above-average volume are generally more reliable than breakouts that occur during low activity.
Volume is responsible for assessing market interest.
Body Size – Strength of the Breakout Candle
A large body of the breakout candle indicates a decisive advantage of one side of the market.
If the candle body is clearly larger than the average of recent candles, the breakout receives additional points.
Body Size is responsible for evaluating the strength of the breakout impulse itself.
Zone Tightness – Market Compression
Not all consolidations have the same value.
The narrower the box relative to the current ATR, the higher the probability that the market is in a compression phase preceding a stronger move.
Zone Tightness is responsible for assessing the quality and compression of the consolidation.
Duration Premium – Maturity of Consolidation
Longer consolidations often lead to more decisive breakouts.
Therefore, the indicator additionally rewards zones that have lasted for a sufficient amount of time.
Duration Premium is responsible for assessing the maturity of the consolidation.
Live Market Analysis
Scoring does not work only at the moment of breakout.
The scoring table analyzes all conditions in real time, even before a signal appears.
This allows the trader to observe how the market situation is changing and which side of the market is gradually gaining an advantage.
In practice, the indicator becomes not only a signal system, but also a tool for continuous evaluation of the current market environment.
Signal Tester
The Signal Tester was designed as a quick tool for evaluating the quality of generated signals.
It is not a full backtesting engine like TradingView Strategy and its results should not be treated as an accurate simulation of real trading.
A simplified operating model was deliberately used because it enables functionalities that are difficult or impossible to achieve in classic strategies.
The tester can simultaneously maintain multiple positions, manage LONG and SHORT trades independently, and — depending on the settings — allow simultaneous opening of positions in both directions. It can also block new entries until the previous position is closed or reject signals that appear too close to already open trades.
Each position receives its own Entry, Take Profit, and Stop Loss levels calculated based on ATR, which makes it possible to quickly compare different scoring configurations without building a full strategy.
The tester’s results are calculated conservatively.
If both the Take Profit and Stop Loss levels could have been reached during a single candle, the tester always assumes that the Stop Loss was hit.
Because the real sequence of price movements inside a single candle is unknown, this approach deliberately underestimates rather than overestimates the results. This effect becomes especially visible with small TP and SL distances, for example 0.5 ATR, where both levels can very often be reached within one candle. The smaller the TP and SL values relative to ATR, the more conservative the tester’s statistics will be.
The tester also does not account for commissions, spreads, or slippage. Therefore its results should be treated as a tool for comparing signal quality and optimizing indicator settings, not as an accurate simulation of real trading results.
█ FEATURES
Consolidation
* Minimum number of candles in consolidation – Minimum number of consecutive candles required to recognize a consolidation zone
* Show consolidation zones – Enables/disables drawing of consolidation boxes on the chart
* Show breakout signals – Enables/disables display of breakout signals (triangles and/or score labels)
* Remove box if breakout did NOT produce a signal (score < threshold) – Automatically removes the box if the breakout did not reach the minimum scoring threshold
* Display signals as – Choose signal display style: triangles only, labels only, or both
* Maximum number of candles in consolidation (0 = no limit) – Maximum duration of consolidation — after exceeding it the box is closed without generating a signal
Candle Size Filter
* Block consolidation start on oversized candle – Prevents starting consolidation after a candle with a very large range
* Max candle range (high-low) × ATR – Threshold for candle size (multiple of ATR calculated before the candle)
Scoring - General
* Minimum score for a signal (weighted sum) – Minimum required Confluence Score to generate a signal
Scoring - Candle Body
* Average body period – Period used to calculate average candle body size
* Signal body multiplier (body > avg × mult) – Multiplier for required body size of the breakout candle
* Condition weight: large body – Point weight of the large body condition
Scoring - ADX
* ADX — period (DMI) – Period of the ADX indicator
* ADX — minimum value – Minimum ADX value required to award a point
* Condition weight: ADX – Point weight of the ADX condition
Scoring - EMA
* EMA — period (trend) – Period of the EMA used for trend evaluation
* Condition weight: price vs EMA – Point weight of the price vs EMA condition
* Condition weight: EMA direction (slope) – Point weight of the EMA slope condition
Scoring - RSI
* RSI — period – Period of the RSI indicator
* Condition weight: RSI – Point weight of the RSI above/below 50 condition
Scoring - Volume
* Volume — average period – Period used to calculate average volume
* Volume — multiplier (vol > avg × mult) – Multiplier for required volume on breakout
* Condition weight: high volume – Point weight of the high volume condition
Scoring - Consolidation Structure
* Zone tightness: max (top-bottom)/ATR – Threshold for zone width relative to ATR (compression)
* Condition weight: zone tightness – Point weight of the zone tightness condition
* Premium: extra candles above minimum – Additional number of candles above minimum required for duration premium
* Condition weight: duration (premium) – Point weight of the duration premium condition
Table
* Table position – Position of the scoring table on the chart
* Table text size – Text size in the scoring table
Colors
* Bullish Color (Long) – Color used for LONG elements
* Bearish Color (Short) – Color used for SHORT elements
* Neutral Color – Color used for neutral elements / no signal
Signal Tester (TP/SL)
* Enable signal tester – Enable/disable the signal tester
* Tester — ATR period – ATR period used by the tester
* Tester — Take Profit × ATR – Take Profit distance in ATR multiples
* Tester — Stop Loss × ATR – Stop Loss distance in ATR multiples
* Block new signals while a position is open – Block new signals until the previous position is closed
* Block signals too close to an existing position – Filter for minimum distance between signals
* Min. distance between signals × ATR – Minimum distance (in ATR) between signals in the same direction
Signal Tester - Table
* Tester table position – Position of the tester statistics table
* Tester table text size – Text size in the tester statistics table
Signal Tester - TP/SL Visualization
* Show TP/SL levels on chart – Display Entry / TP / SL levels on the chart
* Level line width – Width of TP/SL level lines
* Show risk/reward zone fill – Fill color for risk and reward zones
█ APPLICATIONS
The main task of the indicator is to evaluate the quality of the breakout by analyzing the confluence of multiple independent market factors (trend direction and strength, momentum, volume, impulse strength, zone compression, and consolidation maturity). A LONG or SHORT signal is generated only when the total score exceeds the set threshold.
Thanks to this approach, the indicator effectively eliminates a large portion of weak and false breakouts that occur in low-confluence conditions.
The scoring table operates in real time — even before a signal is generated — and allows the trader to observe how a potential opportunity is gradually building up (or falling apart). This is especially useful for early detection of moments when the market begins to meet more and more conditions favorable for a breakout.
The built-in Signal Tester enables quick and convenient comparison of different scoring configurations without the need to write a separate strategy. It allows checking in just a few seconds how changing weights or thresholds affects the historical performance of the signals.
The indicator achieves the best results when used together with support and resistance zone analysis. For example, opening a long position directly under strong resistance is generally not advisable, while a long signal aligned with a support zone usually produces significantly better results. Similarly, short signals appearing near resistance tend to be more effective than those generated without reference to key levels.
The indicator works best when combined with support and resistance analysis.
█ NOTES
* Each of the eight scoring conditions can be independently enabled or disabled by setting its weight to 0.
* The scoring table shows the current market state in real time — it can be used even when signal generation is disabled.
* The Signal Tester operates in conservative mode: if both TP and SL could have been reached on the same candle, it always counts it as a loss. This approach deliberately underestimates results to provide a more realistic picture.
* The tester does not account for commissions, spreads, or slippage — it serves only for comparing signal quality and optimizing settings.
* All modules of the indicator (consolidation detection, scoring, table, tester, TP/SL visualization) can operate completely independently.
* Very long consolidations exceeding the “Maximum number of candles” limit are automatically closed without generating a signal to avoid outdated zones.
* The best results are achieved when the indicator is used together with support and resistance zone analysis. Long signals near support and short signals near resistance are generally significantly more effective.
Release Notes
Added a separate EMA length for evaluating trend direction (slope), independent of the EMA used for price position. Previously both EMA conditions (price vs EMA and EMA direction) used the same average, so they were almost always in agreement — now you can set different periods for each, giving a more independent trend assessment.Open-source script
In true TradingView spirit, the creator of this script has made it open-source, so that traders can review and verify its functionality. Kudos to the author! While you can use it for free, remember that republishing the code is subject to our House Rules.

Disclaimer
The information and publications are not meant to be, and do not constitute, financial, investment, trading, or other types of advice or recommendations supplied or endorsed by TradingView. Read more in the Terms of Use.
Open-source script
In true TradingView spirit, the creator of this script has made it open-source, so that traders can review and verify its functionality. Kudos to the author! While you can use it for free, remember that republishing the code is subject to our House Rules.
Disclaimer
The information and publications are not meant to be, and do not constitute, financial, investment, trading, or other types of advice or recommendations supplied or endorsed by TradingView. Read more in the Terms of Use.