Delta Volume Candles
Delta Volume Candles
OVERVIEW
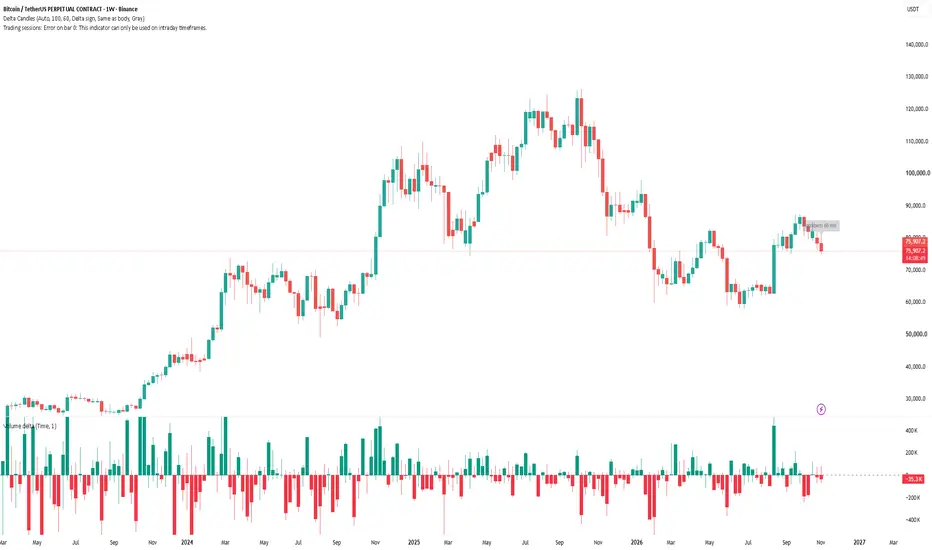
This indicator replaces your normal candles with volume delta candles. Each candle keeps the exact same open, high, low, close, wicks and shape as the regular chart, but its color shows whether buyers or sellers dominated inside that candle, based on volume delta, instead of just where it closed versus where it opened.
This makes it easy to spot candles where price and volume disagree. For example, a green candle with negative delta, or a red candle with positive delta.
HOW IT WORKS
For every chart candle, the script requests lower-timeframe candles (intrabars) with request.security_lower_tf(). The volume of each intrabar is counted as up volume if that intrabar closed higher than it opened, otherwise as down volume.
Volume delta = up volume - down volume
- Positive delta: colored with the "positive" color (default green)
- Negative delta: colored with the "negative" color (default red)
- Zero delta or no intrabar data: colored with the neutral color (default gray)
FEATURES
- Auto intrabar timeframe: picks a lower timeframe (minimum 1 minute) based on your chart timeframe and a target number of intrabars per candle, so weekly, daily and intraday charts all work. Manual mode is also available.
- Two color modes: solid by delta sign, or a gradient where strong delta is more solid and weak delta is more faded.
- Wick and border color: same as body, or by normal candle polarity.
- Divergence highlight: optional color when the candle direction disagrees with its delta.
- Gray candles clearly show bars where no intrabar data is available.
- Data Window values: volume delta, delta %, up volume, down volume and total intrabar volume.
- Fully customizable colors.
HOW TO USE
1. Add the indicator to your chart. The chart timeframe must be higher than the intrabar timeframe (at least 2 minutes when the intrabar timeframe is 1 minute).
2. To see only the delta candles, hide the original candles: chart settings > Symbol > uncheck Body, Borders and Wick. Unchecking these is safer than hiding the symbol, because the price scale and your drawings stay intact.
3. Open the indicator settings to choose Auto or Manual intrabar timeframe, the color mode, and your colors.
4. If many candles appear gray on recent history, lower the "target intrabars per candle" setting to extend the coverage.
NOTES AND LIMITATIONS
- TradingView does not provide true bid/ask volume, so this delta is an approximation built from intrabar price direction. Treat it as a visual aid, not exact order flow.
- TradingView limits how many intrabars can be analyzed (around 100K, depending on plan), so very old history may not have delta data. Those bars show in gray.
- Accuracy improves with more intrabars per candle. Very small chart timeframes (2m to 3m) on a 1m base have only a few intrabars per candle and are less reliable.
- The candles are drawn from the symbol's real OHLC values, so they will not follow Heikin Ashi or other non-standard chart types.
- Other delta indicators may show different values, because they may use different intrabar timeframes and volume-splitting methods.
CREDITS
Written in Pine Script v6 with the help of Claude, an AI assistant by Anthropic. I described the idea and Claude helped write, debug and refine the code.
DISCLAIMER
This indicator is for educational and informational purposes only. It does not provide trading signals or financial advice. Always do your own research and manage your risk.
OVERVIEW
This indicator replaces your normal candles with volume delta candles. Each candle keeps the exact same open, high, low, close, wicks and shape as the regular chart, but its color shows whether buyers or sellers dominated inside that candle, based on volume delta, instead of just where it closed versus where it opened.
This makes it easy to spot candles where price and volume disagree. For example, a green candle with negative delta, or a red candle with positive delta.
HOW IT WORKS
For every chart candle, the script requests lower-timeframe candles (intrabars) with request.security_lower_tf(). The volume of each intrabar is counted as up volume if that intrabar closed higher than it opened, otherwise as down volume.
Volume delta = up volume - down volume
- Positive delta: colored with the "positive" color (default green)
- Negative delta: colored with the "negative" color (default red)
- Zero delta or no intrabar data: colored with the neutral color (default gray)
FEATURES
- Auto intrabar timeframe: picks a lower timeframe (minimum 1 minute) based on your chart timeframe and a target number of intrabars per candle, so weekly, daily and intraday charts all work. Manual mode is also available.
- Two color modes: solid by delta sign, or a gradient where strong delta is more solid and weak delta is more faded.
- Wick and border color: same as body, or by normal candle polarity.
- Divergence highlight: optional color when the candle direction disagrees with its delta.
- Gray candles clearly show bars where no intrabar data is available.
- Data Window values: volume delta, delta %, up volume, down volume and total intrabar volume.
- Fully customizable colors.
HOW TO USE
1. Add the indicator to your chart. The chart timeframe must be higher than the intrabar timeframe (at least 2 minutes when the intrabar timeframe is 1 minute).
2. To see only the delta candles, hide the original candles: chart settings > Symbol > uncheck Body, Borders and Wick. Unchecking these is safer than hiding the symbol, because the price scale and your drawings stay intact.
3. Open the indicator settings to choose Auto or Manual intrabar timeframe, the color mode, and your colors.
4. If many candles appear gray on recent history, lower the "target intrabars per candle" setting to extend the coverage.
NOTES AND LIMITATIONS
- TradingView does not provide true bid/ask volume, so this delta is an approximation built from intrabar price direction. Treat it as a visual aid, not exact order flow.
- TradingView limits how many intrabars can be analyzed (around 100K, depending on plan), so very old history may not have delta data. Those bars show in gray.
- Accuracy improves with more intrabars per candle. Very small chart timeframes (2m to 3m) on a 1m base have only a few intrabars per candle and are less reliable.
- The candles are drawn from the symbol's real OHLC values, so they will not follow Heikin Ashi or other non-standard chart types.
- Other delta indicators may show different values, because they may use different intrabar timeframes and volume-splitting methods.
CREDITS
Written in Pine Script v6 with the help of Claude, an AI assistant by Anthropic. I described the idea and Claude helped write, debug and refine the code.
DISCLAIMER
This indicator is for educational and informational purposes only. It does not provide trading signals or financial advice. Always do your own research and manage your risk.

Disclaimer
The information and publications are not meant to be, and do not constitute, financial, investment, trading, or other types of advice or recommendations supplied or endorsed by TradingView. Read more in the Terms of Use.
Disclaimer
The information and publications are not meant to be, and do not constitute, financial, investment, trading, or other types of advice or recommendations supplied or endorsed by TradingView. Read more in the Terms of Use.