PINE LIBRARY
Updated MonthlyPerformanceV2
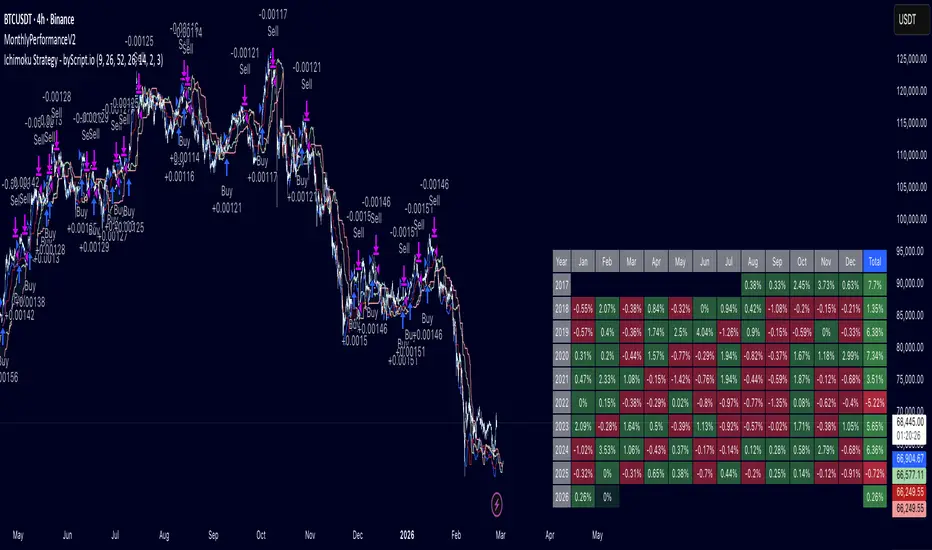
This library provides a plug-and-play monthly performance table for strategy scripts.
It automatically tracks and displays profit/loss per month and year directly on your chart.
─────────────────────────────────────
🔧 FUNCTION
─────────────────────────────────────
trackAndDraw(initialCapital, showInPercentage)
Parameters:
- initialCapital (float) — The starting capital of your strategy.
Tip: use `strategy.initial_capital` for automatic sync.
- showInPercentage (bool) — Display mode:
`true` → shows monthly result in % (compounding)
`false` → shows monthly result in USD (normalized to initial capital)
─────────────────────────────────────
📊 FEATURES
─────────────────────────────────────
- Compounding % calculation per month and per year
- Dual display mode: percentage or USD equivalent
- Color-coded cells (green / red) for quick visual reading
- Running month tracker (current open month, lighter color)
- Annual total column with compounding yearly return
- Auto-limits display to the 19 most recent years to prevent table overflow
─────────────────────────────────────
🚀 HOW TO USE
─────────────────────────────────────
add this 2 lines code to your script
import edwinardyanto/MonthlyPerformance/1 as mp
mp.trackAndDraw(strategy.initial_capital, true)
─────────────────────────────────────
📌 NOTES
─────────────────────────────────────
- Only compatible with strategy scripts (requires strategy.equity)
- Call trackAndDraw() once, outside any conditional block
- Table is displayed at bottom-right of the chart
- Older years beyond the 19-year limit are excluded from display
but still calculated internally
It automatically tracks and displays profit/loss per month and year directly on your chart.
─────────────────────────────────────
🔧 FUNCTION
─────────────────────────────────────
trackAndDraw(initialCapital, showInPercentage)
Parameters:
- initialCapital (float) — The starting capital of your strategy.
Tip: use `strategy.initial_capital` for automatic sync.
- showInPercentage (bool) — Display mode:
`true` → shows monthly result in % (compounding)
`false` → shows monthly result in USD (normalized to initial capital)
─────────────────────────────────────
📊 FEATURES
─────────────────────────────────────
- Compounding % calculation per month and per year
- Dual display mode: percentage or USD equivalent
- Color-coded cells (green / red) for quick visual reading
- Running month tracker (current open month, lighter color)
- Annual total column with compounding yearly return
- Auto-limits display to the 19 most recent years to prevent table overflow
─────────────────────────────────────
🚀 HOW TO USE
─────────────────────────────────────
add this 2 lines code to your script
import edwinardyanto/MonthlyPerformance/1 as mp
mp.trackAndDraw(strategy.initial_capital, true)
─────────────────────────────────────
📌 NOTES
─────────────────────────────────────
- Only compatible with strategy scripts (requires strategy.equity)
- Call trackAndDraw() once, outside any conditional block
- Table is displayed at bottom-right of the chart
- Older years beyond the 19-year limit are excluded from display
but still calculated internally
Release Notes
v2better visual
Pine library
In true TradingView spirit, the author has published this Pine code as an open-source library so that other Pine programmers from our community can reuse it. Cheers to the author! You may use this library privately or in other open-source publications, but reuse of this code in publications is governed by House Rules.

Disclaimer
The information and publications are not meant to be, and do not constitute, financial, investment, trading, or other types of advice or recommendations supplied or endorsed by TradingView. Read more in the Terms of Use.
Pine library
In true TradingView spirit, the author has published this Pine code as an open-source library so that other Pine programmers from our community can reuse it. Cheers to the author! You may use this library privately or in other open-source publications, but reuse of this code in publications is governed by House Rules.
Disclaimer
The information and publications are not meant to be, and do not constitute, financial, investment, trading, or other types of advice or recommendations supplied or endorsed by TradingView. Read more in the Terms of Use.