Marci Silfran (Full-Day Trendlines & Multi-Timeframe Matrix)
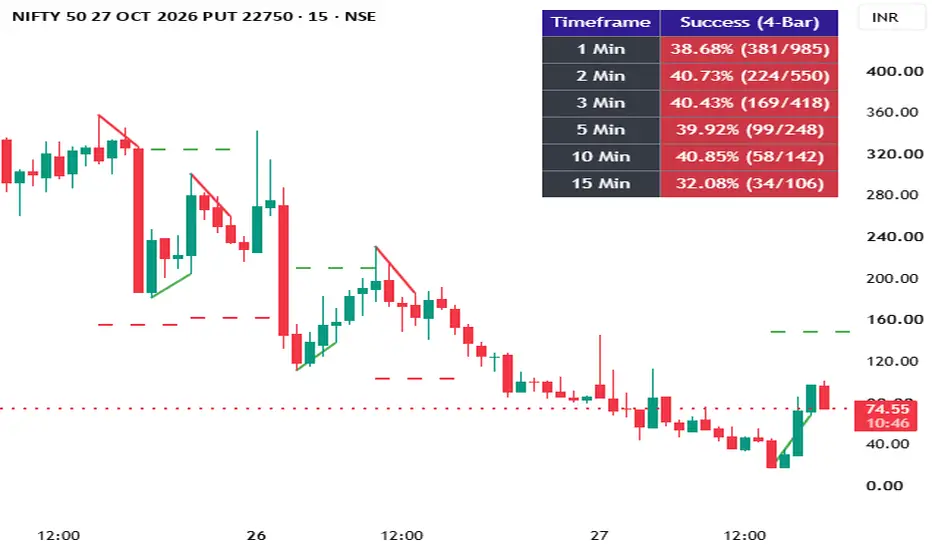
Indicator Description - Trendline & Distance A Geometry
Overview
`Marci Silfran` is an advanced technical analysis indicator designed to project dynamic Support and Resistance target lines based on precise candlestick wick geometry and multi-timeframe performance tracking.
Core Logic & Formula
1. Trendline Construction: Automatically identifies valid swing anchor points across a user-defined lookback window (2 to 8 candles) and plots a trendline connecting the anchor wicks to the current candle.
2. Distance A Measurement: Scans the intermediate candles within the lookback span to locate the extreme wick (lowest wick in a downtrend, highest wick in an uptrend) that extends beyond the baseline trendline. It calculates the vertical distance (Distance A) between the trendline and that extreme wick.
3. Parallel Projection: Projects Distance A in parallel from the anchor structure to plot a non-floating, highly accurate dashed support or resistance target line.
Features
Configurable Lookback: Easily adjust the candle lookback window (`[2, 3, 4, 5, 6, 8]`) directly from the input settings.
Multi-Timeframe Matrix Table: Displays a real-time performance tracking table on your chart showing signal counts and success rates across 1-minute, 2-minute, 3-minute, 5-minute, 10-minute, and 15-minute timeframes.
Clean Visuals: Fully customized color options for uptrends and downtrends with zero floating artifacts.
Overview
`Marci Silfran` is an advanced technical analysis indicator designed to project dynamic Support and Resistance target lines based on precise candlestick wick geometry and multi-timeframe performance tracking.
Core Logic & Formula
1. Trendline Construction: Automatically identifies valid swing anchor points across a user-defined lookback window (2 to 8 candles) and plots a trendline connecting the anchor wicks to the current candle.
2. Distance A Measurement: Scans the intermediate candles within the lookback span to locate the extreme wick (lowest wick in a downtrend, highest wick in an uptrend) that extends beyond the baseline trendline. It calculates the vertical distance (Distance A) between the trendline and that extreme wick.
3. Parallel Projection: Projects Distance A in parallel from the anchor structure to plot a non-floating, highly accurate dashed support or resistance target line.
Features
Configurable Lookback: Easily adjust the candle lookback window (`[2, 3, 4, 5, 6, 8]`) directly from the input settings.
Multi-Timeframe Matrix Table: Displays a real-time performance tracking table on your chart showing signal counts and success rates across 1-minute, 2-minute, 3-minute, 5-minute, 10-minute, and 15-minute timeframes.
Clean Visuals: Fully customized color options for uptrends and downtrends with zero floating artifacts.

Disclaimer
The information and publications are not meant to be, and do not constitute, financial, investment, trading, or other types of advice or recommendations supplied or endorsed by TradingView. Read more in the Terms of Use.
Disclaimer
The information and publications are not meant to be, and do not constitute, financial, investment, trading, or other types of advice or recommendations supplied or endorsed by TradingView. Read more in the Terms of Use.