Pullback Master [SimpleAlgo]
█ INTRODUCING PULLBACK MASTER
Every trend trader is told the same thing: buy the pullback. Nobody tells them which one. The first pullback of a new trend and the sixth pullback of an old one look identical on a chart with a moving average on it, and they are not the same trade.
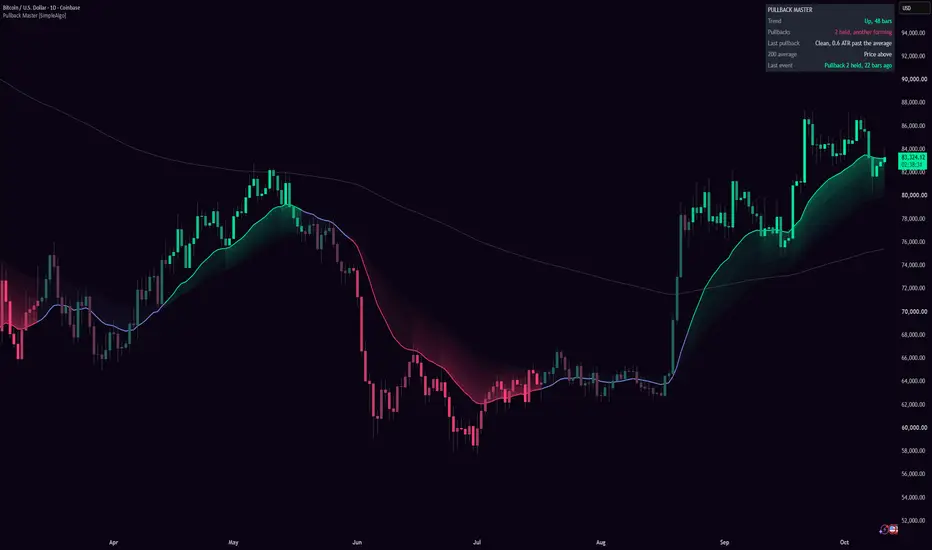
Pullback Master counts them. It finds a trend, watches price come back to the trend average and lift off again, and counts each pullback that holds. It measures how deep each one went, notes whether price closed through the average on the way, and tells you whether the pullbacks are getting shallower or deeper. Then it shows the count on the chart without a single label: the ribbon behind the trend average charges up with each pullback that holds, brightest around the third and fourth, and fades again as the trend gets old.

There are no labels on the chart. The ribbon's colour says whether there is a trend, its brightness says how far along the trend is, and a soft glow marks each place price came back to the average. The panel in the corner says it in words: the trend and its age, how many pullbacks have held and whether they are getting deeper, how the last one behaved, where price sits against the long-term average, and the last event. The five moments worth knowing about are alerts.

⚪ The ribbon
The ribbon is a fan of seven averages behind the trend average, from 15% longer to two and a half times longer. In a trend they spread out behind the trend average like a comet tail; in chop they collapse onto it. The whole fan is one colour: mint in an uptrend, pink in a downtrend, the no-trend blue when there is neither. It is densest at the trend average and fades outward, so the eye lands on the line price actually pulls back to.
⚪ The count
Each pullback that holds raises the ribbon's brightness one step: dim with none, brighter at one and two, brightest at three and four, then fading from the fifth on. That is the whole read in one glance: a dim ribbon in a trend is either a fresh trend or a tired one, and the panel says which.
⚪ What's different
A moving average ribbon shows you a trend. This one shows you where you are in it. The pullbacks are counted, measured and graded, the ribbon carries the count, and the panel reads the trend's health off them: shallower pullbacks are a healthy trend, deeper ones are a tiring one, a pullback that closed through the average is weaker than one that held cleanly. None of that is in the picture a ribbon gives you.
█ HOW IT WORKS
⚪ 1. The averages
The trend average is a 20-bar EMA. The fan behind it is seven more, each longer than the last by a growing step, so the layers sit tight near the trend average and spread further out:
Pine Script®
Pine Script®
A 200-bar EMA is drawn as a thin grey line for context, and everything is measured in ATRs, so the same rules mean the same thing on gold, on bitcoin and on a stock:
Pine Script®
⚪ 2. When a trend starts
Three things have to be true on a closed bar. The trend average has to be rising steeply enough, a quarter of an ATR over the last five bars by default; the fan has to have opened, with the trend average above its slowest layer; and price has to close above the trend average on an up candle:
Pine Script®
Pine Script®
A downtrend is the mirror. And none of this is looked at while the market is choppy, which means price has closed through the trend average more than twice in the last twenty bars:
Pine Script®
⚪ 3. When a trend ends
A trend ends when the trend average has turned the other way, or when price closes out the far side of the fan while the average is no longer rising:
Pine Script®
That rule is deliberately slow. A sharp dip inside a strong trend is a deep pullback, not an ending, and it should count as one. If the same trend comes back within ten bars of ending, it resumes with its pullback count intact, so one bad bar doesn't reset the count.
⚪ 4. A pullback
A pullback begins when price has first moved at least three quarters of an ATR away from the trend average and then comes back to within a fifth of an ATR of it:
Pine Script®
The distance rule is what makes the count mean something. Without it, a trend that rides along its average would count a pullback every few bars. With it, a pullback is a real swing away and back.
While the pullback is on, the script records its deepest point and whether any bar closed through the average. It holds when price closes back above the average on an up candle:
Pine Script®
That is the moment the count goes up, the depth is measured, and the pullback is graded clean or closed through:
Pine Script®

⚪ 5. Grading
Two things are graded. Depth: how far past the average the pullback reached, in ATRs. A pullback that bounced before the average reads as held at the average. And cleanliness: whether any bar closed through the average before it recovered. A clean, shallow pullback is the trend at its healthiest. A pullback that closed through and reached an ATR past the average is counted, because it held in the end, but the panel shows it in the down colour and the Pullbacks row says whether the pullbacks are getting deeper.

⚪ 6. The ribbon's brightness
The fan's transparency is set by the count, so the count is on the chart without a label:
Pine Script®
While price is at the average the ribbon glows, and the glow dies away over the following bars, so each pullback leaves a soft mark in the ribbon where it happened. The glow is smoothed and held to steps so it reads as a patch of light, not a stripe:
Pine Script®

⚪ 7. Candles
Candles take the trend colour, with counter-trend bars muted and no-trend bars dim, so a screenshot reads at a glance. Turn it off in the settings if you prefer your own candle colours.
⚪ 8. The panel

⚪ Repainting
Every decision is made on closed bars only. The ribbon and the averages update on the live bar like any moving average does, but a trend, a pullback and its grade are only ever decided when the bar closes, and never change afterwards.
█ WHY IT IS ORIGINAL
The ingredients are a fan of EMAs and an ATR, and we won't pretend otherwise. What is new is what is done with them. A ribbon tells you the direction and, by its width, roughly the strength. Pullback Master treats the pullbacks inside a trend as the unit of analysis: it defines one precisely, a swing away from the average and a return that lifts off, counts them, measures each one's depth and whether it closed through, and reads the trend's health from how the sequence is changing. The ribbon's brightness is driven by that count, so the chart carries the reading with no labels, and the panel states it in words. The distance rule, the slow ending rule and the resume rule exist so that the count means what a trader means by "the third pullback". None of that is in a ribbon or a moving average crossover.
█ HOW TO USE IT
⚪ Colour first
Mint, there is an uptrend. Pink, a downtrend. Blue, there is no trend, and the panel will say if that is because the market is choppy. A blue ribbon is the one reading most trend tools skip: it means the average is not something to buy pullbacks to right now.
⚪ Then the brightness
A dim mint ribbon with a low count is a young trend. A bright one is a trend that has held two, three or four pullbacks: proven, and still with room. A ribbon that has dimmed again after the fifth is a trend that has been going a long time, and the Pullbacks row will usually say the pullbacks are getting deeper by then.
⚪ The pullback itself
The only moment worth waiting for is the one the alert names: price came back to the average and lifted off. Read the grade before acting on it. A clean, shallow pullback in a bright ribbon is the textbook setup. A pullback that closed through, in a trend whose pullbacks are getting deeper, is a trend being tested, and the next one often doesn't hold.
⚪ Timeframes
With the defaults a trend is a 20-bar structure, so on a 5-minute chart a trend lasts hours and holds several pullbacks a session, on a 1-hour chart it lasts days, and on a daily chart it is a quarter or more. On higher timeframes trends hold fewer pullbacks, so the count stays low and the ribbon rarely reaches its brightest; that is the market, not the script.

⚪ If you're new
Three sentences. The coloured line is the trend's average, and the fan behind it lights up while there is a trend worth following: mint up, pink down, blue none. Each time price comes back to the line and bounces, that is a pullback that held, and the fan gets brighter, up to the third or fourth, then dimmer. The best pullbacks are the early, shallow, clean ones in a bright fan; the ones to be careful with are the deep ones in a trend that is already old.
None of this predicts where price goes. A pullback that held is a description of what just happened, not a signal to buy or sell. Use it with your own analysis and manage your risk.
█ SETTINGS
⚪ Averages
⚪ Trend
⚪ Look
Everything else, the fan's spacing, the chop rule, the distance a pullback has to travel, the resume window and the brightness steps, is fixed. Those numbers are right or wrong rather than a matter of taste, and we would rather you didn't have to think about them.
█ ALERTS
Set them to "Once per bar close". Everything is decided on closed bars.
█ NOTES AND LIMITS
█ DISCLAIMER
This script is for education and information. It isn't financial advice, a recommendation to buy or sell anything, or a promise about what any market will do. Past behaviour of a market, a method or an indicator doesn't guarantee future results, and nothing on this chart replaces your own judgement. Trading involves risk and you are responsible for your decisions.
Every trend trader is told the same thing: buy the pullback. Nobody tells them which one. The first pullback of a new trend and the sixth pullback of an old one look identical on a chart with a moving average on it, and they are not the same trade.
Pullback Master counts them. It finds a trend, watches price come back to the trend average and lift off again, and counts each pullback that holds. It measures how deep each one went, notes whether price closed through the average on the way, and tells you whether the pullbacks are getting shallower or deeper. Then it shows the count on the chart without a single label: the ribbon behind the trend average charges up with each pullback that holds, brightest around the third and fourth, and fades again as the trend gets old.
There are no labels on the chart. The ribbon's colour says whether there is a trend, its brightness says how far along the trend is, and a soft glow marks each place price came back to the average. The panel in the corner says it in words: the trend and its age, how many pullbacks have held and whether they are getting deeper, how the last one behaved, where price sits against the long-term average, and the last event. The five moments worth knowing about are alerts.
⚪ The ribbon
The ribbon is a fan of seven averages behind the trend average, from 15% longer to two and a half times longer. In a trend they spread out behind the trend average like a comet tail; in chop they collapse onto it. The whole fan is one colour: mint in an uptrend, pink in a downtrend, the no-trend blue when there is neither. It is densest at the trend average and fades outward, so the eye lands on the line price actually pulls back to.
⚪ The count
Each pullback that holds raises the ribbon's brightness one step: dim with none, brighter at one and two, brightest at three and four, then fading from the fifth on. That is the whole read in one glance: a dim ribbon in a trend is either a fresh trend or a tired one, and the panel says which.
⚪ What's different
A moving average ribbon shows you a trend. This one shows you where you are in it. The pullbacks are counted, measured and graded, the ribbon carries the count, and the panel reads the trend's health off them: shallower pullbacks are a healthy trend, deeper ones are a tiring one, a pullback that closed through the average is weaker than one that held cleanly. None of that is in the picture a ribbon gives you.
█ HOW IT WORKS
⚪ 1. The averages
The trend average is a 20-bar EMA. The fan behind it is seven more, each longer than the last by a growing step, so the layers sit tight near the trend average and spread further out:
A 200-bar EMA is drawn as a thin grey line for context, and everything is measured in ATRs, so the same rules mean the same thing on gold, on bitcoin and on a stock:
⚪ 2. When a trend starts
Three things have to be true on a closed bar. The trend average has to be rising steeply enough, a quarter of an ATR over the last five bars by default; the fan has to have opened, with the trend average above its slowest layer; and price has to close above the trend average on an up candle:
A downtrend is the mirror. And none of this is looked at while the market is choppy, which means price has closed through the trend average more than twice in the last twenty bars:
⚪ 3. When a trend ends
A trend ends when the trend average has turned the other way, or when price closes out the far side of the fan while the average is no longer rising:
That rule is deliberately slow. A sharp dip inside a strong trend is a deep pullback, not an ending, and it should count as one. If the same trend comes back within ten bars of ending, it resumes with its pullback count intact, so one bad bar doesn't reset the count.
⚪ 4. A pullback
A pullback begins when price has first moved at least three quarters of an ATR away from the trend average and then comes back to within a fifth of an ATR of it:
The distance rule is what makes the count mean something. Without it, a trend that rides along its average would count a pullback every few bars. With it, a pullback is a real swing away and back.
While the pullback is on, the script records its deepest point and whether any bar closed through the average. It holds when price closes back above the average on an up candle:
That is the moment the count goes up, the depth is measured, and the pullback is graded clean or closed through:
⚪ 5. Grading
Two things are graded. Depth: how far past the average the pullback reached, in ATRs. A pullback that bounced before the average reads as held at the average. And cleanliness: whether any bar closed through the average before it recovered. A clean, shallow pullback is the trend at its healthiest. A pullback that closed through and reached an ATR past the average is counted, because it held in the end, but the panel shows it in the down colour and the Pullbacks row says whether the pullbacks are getting deeper.
⚪ 6. The ribbon's brightness
The fan's transparency is set by the count, so the count is on the chart without a label:
While price is at the average the ribbon glows, and the glow dies away over the following bars, so each pullback leaves a soft mark in the ribbon where it happened. The glow is smoothed and held to steps so it reads as a patch of light, not a stripe:
⚪ 7. Candles
Candles take the trend colour, with counter-trend bars muted and no-trend bars dim, so a screenshot reads at a glance. Turn it off in the settings if you prefer your own candle colours.
⚪ 8. The panel
- Trend: Up or Down and how many bars old, None, or None, choppy while the stand-aside rule is on.
- Pullbacks: how many have held in this trend, and whether they are getting shallower or deeper. With no trend, the count from the last trend stays up.
- Last pullback: Clean or Closed through, and how far past the average it reached.
- 200 average: whether price is above or below the long-term average.
- Last event: the most recent event and how long ago.
⚪ Repainting
Every decision is made on closed bars only. The ribbon and the averages update on the live bar like any moving average does, but a trend, a pullback and its grade are only ever decided when the bar closes, and never change afterwards.
█ WHY IT IS ORIGINAL
The ingredients are a fan of EMAs and an ATR, and we won't pretend otherwise. What is new is what is done with them. A ribbon tells you the direction and, by its width, roughly the strength. Pullback Master treats the pullbacks inside a trend as the unit of analysis: it defines one precisely, a swing away from the average and a return that lifts off, counts them, measures each one's depth and whether it closed through, and reads the trend's health from how the sequence is changing. The ribbon's brightness is driven by that count, so the chart carries the reading with no labels, and the panel states it in words. The distance rule, the slow ending rule and the resume rule exist so that the count means what a trader means by "the third pullback". None of that is in a ribbon or a moving average crossover.
█ HOW TO USE IT
⚪ Colour first
Mint, there is an uptrend. Pink, a downtrend. Blue, there is no trend, and the panel will say if that is because the market is choppy. A blue ribbon is the one reading most trend tools skip: it means the average is not something to buy pullbacks to right now.
⚪ Then the brightness
A dim mint ribbon with a low count is a young trend. A bright one is a trend that has held two, three or four pullbacks: proven, and still with room. A ribbon that has dimmed again after the fifth is a trend that has been going a long time, and the Pullbacks row will usually say the pullbacks are getting deeper by then.
⚪ The pullback itself
The only moment worth waiting for is the one the alert names: price came back to the average and lifted off. Read the grade before acting on it. A clean, shallow pullback in a bright ribbon is the textbook setup. A pullback that closed through, in a trend whose pullbacks are getting deeper, is a trend being tested, and the next one often doesn't hold.
⚪ Timeframes
With the defaults a trend is a 20-bar structure, so on a 5-minute chart a trend lasts hours and holds several pullbacks a session, on a 1-hour chart it lasts days, and on a daily chart it is a quarter or more. On higher timeframes trends hold fewer pullbacks, so the count stays low and the ribbon rarely reaches its brightest; that is the market, not the script.
⚪ If you're new
Three sentences. The coloured line is the trend's average, and the fan behind it lights up while there is a trend worth following: mint up, pink down, blue none. Each time price comes back to the line and bounces, that is a pullback that held, and the fan gets brighter, up to the third or fourth, then dimmer. The best pullbacks are the early, shallow, clean ones in a bright fan; the ones to be careful with are the deep ones in a trend that is already old.
None of this predicts where price goes. A pullback that held is a description of what just happened, not a signal to buy or sell. Use it with your own analysis and manage your risk.
█ SETTINGS
⚪ Averages
- Trend average (bars): the average price pulls back to. 20 by default.
- Long-term average (bars): the context line. 200 by default.
- Show the long-term average: on by default.
⚪ Trend
- Trend strictness: how steep the trend average has to be before a trend counts. Normal by default. Strict means fewer, cleaner trends; Relaxed catches more and ends more in chop.
- Only count trends on the right side of the long-term average: uptrends only above it, downtrends only below it. Off by default.
- Also alert on pullback number: every pullback that holds has an alert. This one gets its own, so you can be told about the second or third pullback of a trend and nothing else. 3 by default.
⚪ Look
- Theme: Neon, Classic, Aurora, Ice, or Custom with your own up, down and no-trend colours.
- Brightness: 1 to 5, for your screen and background.
- Colour candles by trend: on by default.
- Panel: position and size.
Everything else, the fan's spacing, the chop rule, the distance a pullback has to travel, the resume window and the brightness steps, is fixed. Those numbers are right or wrong rather than a matter of taste, and we would rather you didn't have to think about them.
█ ALERTS
- New uptrend, New downtrend.
- Pullback held.
- Chosen pullback held (the number you set).
- Trend ended.
Set them to "Once per bar close". Everything is decided on closed bars.
█ NOTES AND LIMITS
- A trend starts late by design. It needs a rising average, an open fan and a close on the right side, which usually means the first leg is already in. The first pullback is the earliest the script will put you in a trend, and that is the point: it is a pullback tool, not a breakout tool.
- A trend ends late too. The ending rule is slow so that deep pullbacks count as pullbacks. The cost is that a real reversal is a few bars old before the ribbon turns blue.
- The distance rule means a trend that grinds along its average without ever leaving it counts few or no pullbacks. The ribbon stays dim and the panel says so. That is accurate: there was nothing to pull back from.
- Depth is in ATRs, so the same pullback reads deeper on a quiet day than on a wild one. That is the point of the unit, but keep it in mind when comparing across days.
- The chop rule stands aside after three closes through the average in twenty bars. In a slow, steady trend that hugs its average it can trigger falsely, and the panel will read None, choppy until the crosses age out.
- The count is per trend. A trend that ends and restarts outside the ten-bar resume window starts at zero again, even if it looks like the same move to you.
- The ribbon is seven fills. On very long charts or slow machines, this is the first thing to suspect if the chart feels heavy.
█ DISCLAIMER
This script is for education and information. It isn't financial advice, a recommendation to buy or sell anything, or a promise about what any market will do. Past behaviour of a market, a method or an indicator doesn't guarantee future results, and nothing on this chart replaces your own judgement. Trading involves risk and you are responsible for your decisions.

Access our exclusive invite-only scripts: simplealgo.io
Join our discord: discord.gg/simplealgo
Join our discord: discord.gg/simplealgo
Disclaimer
The information and publications are not meant to be, and do not constitute, financial, investment, trading, or other types of advice or recommendations supplied or endorsed by TradingView. Read more in the Terms of Use.
Access our exclusive invite-only scripts: simplealgo.io
Join our discord: discord.gg/simplealgo
Join our discord: discord.gg/simplealgo
Disclaimer
The information and publications are not meant to be, and do not constitute, financial, investment, trading, or other types of advice or recommendations supplied or endorsed by TradingView. Read more in the Terms of Use.