OPEN-SOURCE SCRIPT
Updated CL OVX Implied Daily Range
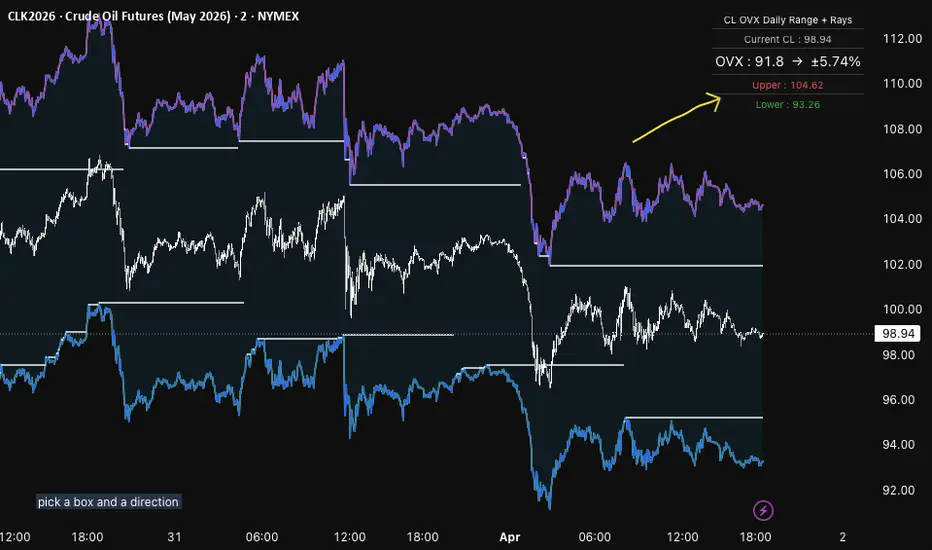
This indicator combines the CBOE OVX Implied Daily Range (Black-Scholes style) with dynamic Rays. It plots the expected daily trading range for Crude Oil (CL) based on current OVX volatility.
On top of that, it automatically draws two special horizontal rays:
Ray 1: Fires from the lowest point the upper band has reached in the selected lookback period. Ray 2: Fires from the highest point the lower band has reached in the same period.
Each ray continues extending right until the opposite ray triggers (stops when other fires, and vice versa). This creates clean, non-cluttered reference levels.
The result is a volatility-based range with intelligent horizontal support/resistance rays that adapt to the actual behavior of the implied range.
Main Use Cases
Dynamic Support & Resistance
The top rays often acts as a strong overhead resistance level once the upper band has been “pushed down.” The bottom rays frequently acts as dynamic support when the lower band has been “pushed up.”
Mean Reversion Trading
Many traders use these rays as targets or mean-reversion zones. For example, if price is near the upper band and a ray is active, it highlights a high-probability area where price may stall or reverse.
Breakout Confirmation
When price breaks and holds above the upper ray (or below the lower ray), it can signal stronger momentum because it has cleared the recent “tightest” implied range boundary.
Volatility Context
Helps you visually see when the implied range is contracting (rays appear closer together) or when it’s expanding, giving you better context for position sizing and stop placement.
Intraday / Swing Trading on CL
Very useful on 15min, 30min, 1H, and 4H charts for Crude Oil to identify high-probability bounce or rejection zones based on options-implied volatility.
On top of that, it automatically draws two special horizontal rays:
Ray 1: Fires from the lowest point the upper band has reached in the selected lookback period. Ray 2: Fires from the highest point the lower band has reached in the same period.
Each ray continues extending right until the opposite ray triggers (stops when other fires, and vice versa). This creates clean, non-cluttered reference levels.
The result is a volatility-based range with intelligent horizontal support/resistance rays that adapt to the actual behavior of the implied range.
Main Use Cases
Dynamic Support & Resistance
The top rays often acts as a strong overhead resistance level once the upper band has been “pushed down.” The bottom rays frequently acts as dynamic support when the lower band has been “pushed up.”
Mean Reversion Trading
Many traders use these rays as targets or mean-reversion zones. For example, if price is near the upper band and a ray is active, it highlights a high-probability area where price may stall or reverse.
Breakout Confirmation
When price breaks and holds above the upper ray (or below the lower ray), it can signal stronger momentum because it has cleared the recent “tightest” implied range boundary.
Volatility Context
Helps you visually see when the implied range is contracting (rays appear closer together) or when it’s expanding, giving you better context for position sizing and stop placement.
Intraday / Swing Trading on CL
Very useful on 15min, 30min, 1H, and 4H charts for Crude Oil to identify high-probability bounce or rejection zones based on options-implied volatility.
Release Notes
show fill checkbox wasn't working. it is now.Open-source script
In true TradingView spirit, the creator of this script has made it open-source, so that traders can review and verify its functionality. Kudos to the author! While you can use it for free, remember that republishing the code is subject to our House Rules.

Disclaimer
The information and publications are not meant to be, and do not constitute, financial, investment, trading, or other types of advice or recommendations supplied or endorsed by TradingView. Read more in the Terms of Use.
Open-source script
In true TradingView spirit, the creator of this script has made it open-source, so that traders can review and verify its functionality. Kudos to the author! While you can use it for free, remember that republishing the code is subject to our House Rules.
Disclaimer
The information and publications are not meant to be, and do not constitute, financial, investment, trading, or other types of advice or recommendations supplied or endorsed by TradingView. Read more in the Terms of Use.