Overnight Range Breakout [ONRB]
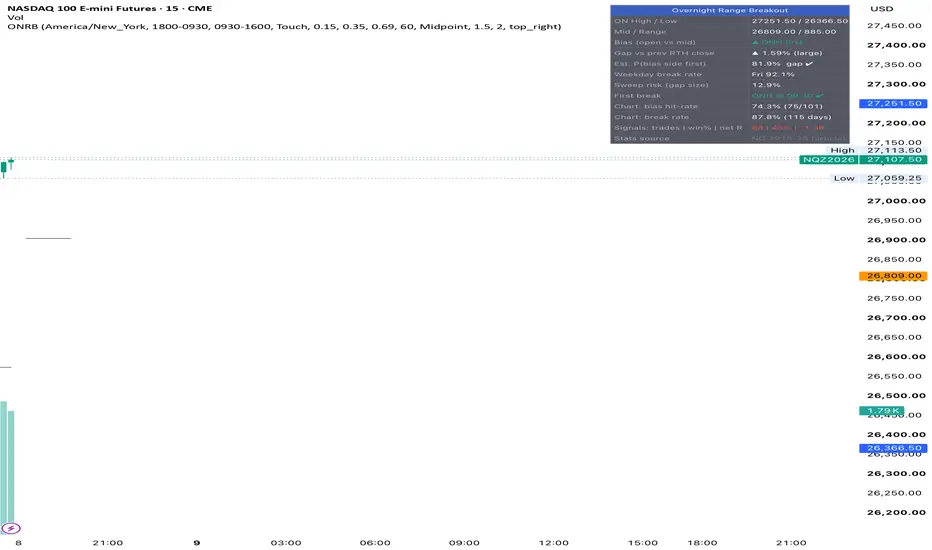
OVERNIGHT RANGE BREAKOUT (ONRB)
Plots the overnight session range (high, low, midpoint) on futures and shows which side the regular session is statistically more likely to break first, based on where the 09:30 ET open sits relative to the overnight midpoint.
WHAT IT DOES
• Tracks the overnight range from 18:00 to 09:30 ET (the Globex session) as it develops, then freezes the high, low and midpoint at the RTH open.
• Reads the bias at 09:30 ET: open above the midpoint = the overnight high is expected to break first; open below = the overnight low is expected to break first.
• Labels the first break of either overnight level, how many minutes after the open it happened, and whether it agreed with the bias (✔ / ✖).
• Marks "sweep" days, where both overnight levels get broken.
• Shows a dashboard: levels, bias, gap size and direction, an estimated probability, weekday break rate, sweep risk, and running hit-rate statistics measured on your own chart's history.
• Optional long/short signals on the first break in the direction of the bias, with a stop (midpoint, opposite level or ATR) and an R-multiple target. The dashboard tallies the result of these signals in R.
• Alerts for the bias, first break of the high or low, sweeps, and signals.
HOW IT WORKS
1. Overnight range: highest high and lowest low between 18:00 and 09:30 ET. Session times are calculated in New York time, so your chart's timezone doesn't matter.
2. Bias: compares the 09:30 open with the overnight midpoint, (High + Low) / 2.
3. Gap: the open is compared with the previous RTH close and sorted into four size buckets: tiny, small, medium and large. The thresholds are adjustable in the settings.
4. Break detection: a level counts as broken when price trades beyond it (default) or when a bar closes beyond it (optional). The first level broken during RTH is the "first break".
5. Signals (optional): the first break in the bias direction inside your chosen time window triggers a signal. The script then follows a hypothetical trade to the stop, the target, or the end of RTH, and adds the result to a running R total.
ABOUT THE PERCENTAGES
The probabilities in the dashboard (bias hit rate by gap size, weekday break rates, sweep rates) are hard-coded from a published study of NQ futures, January 2015 to December 2025, by tradingstats.net. They are the study's figures. I have not independently verified them, and they will not update. They may not hold on other symbols, other periods, or in the future. The "Chart:" rows in the dashboard calculate the same statistics from the data loaded on your chart, so you can compare them with the study.
Plots the overnight session range (high, low, midpoint) on futures and shows which side the regular session is statistically more likely to break first, based on where the 09:30 ET open sits relative to the overnight midpoint.
WHAT IT DOES
• Tracks the overnight range from 18:00 to 09:30 ET (the Globex session) as it develops, then freezes the high, low and midpoint at the RTH open.
• Reads the bias at 09:30 ET: open above the midpoint = the overnight high is expected to break first; open below = the overnight low is expected to break first.
• Labels the first break of either overnight level, how many minutes after the open it happened, and whether it agreed with the bias (✔ / ✖).
• Marks "sweep" days, where both overnight levels get broken.
• Shows a dashboard: levels, bias, gap size and direction, an estimated probability, weekday break rate, sweep risk, and running hit-rate statistics measured on your own chart's history.
• Optional long/short signals on the first break in the direction of the bias, with a stop (midpoint, opposite level or ATR) and an R-multiple target. The dashboard tallies the result of these signals in R.
• Alerts for the bias, first break of the high or low, sweeps, and signals.
HOW IT WORKS
1. Overnight range: highest high and lowest low between 18:00 and 09:30 ET. Session times are calculated in New York time, so your chart's timezone doesn't matter.
2. Bias: compares the 09:30 open with the overnight midpoint, (High + Low) / 2.
3. Gap: the open is compared with the previous RTH close and sorted into four size buckets: tiny, small, medium and large. The thresholds are adjustable in the settings.
4. Break detection: a level counts as broken when price trades beyond it (default) or when a bar closes beyond it (optional). The first level broken during RTH is the "first break".
5. Signals (optional): the first break in the bias direction inside your chosen time window triggers a signal. The script then follows a hypothetical trade to the stop, the target, or the end of RTH, and adds the result to a running R total.
ABOUT THE PERCENTAGES
The probabilities in the dashboard (bias hit rate by gap size, weekday break rates, sweep rates) are hard-coded from a published study of NQ futures, January 2015 to December 2025, by tradingstats.net. They are the study's figures. I have not independently verified them, and they will not update. They may not hold on other symbols, other periods, or in the future. The "Chart:" rows in the dashboard calculate the same statistics from the data loaded on your chart, so you can compare them with the study.

Disclaimer
The information and publications are not meant to be, and do not constitute, financial, investment, trading, or other types of advice or recommendations supplied or endorsed by TradingView. Read more in the Terms of Use.
Disclaimer
The information and publications are not meant to be, and do not constitute, financial, investment, trading, or other types of advice or recommendations supplied or endorsed by TradingView. Read more in the Terms of Use.