OPEN-SOURCE SCRIPT
Customized Double Bollinger Bands [wjdtks255]
■ Technical Overview
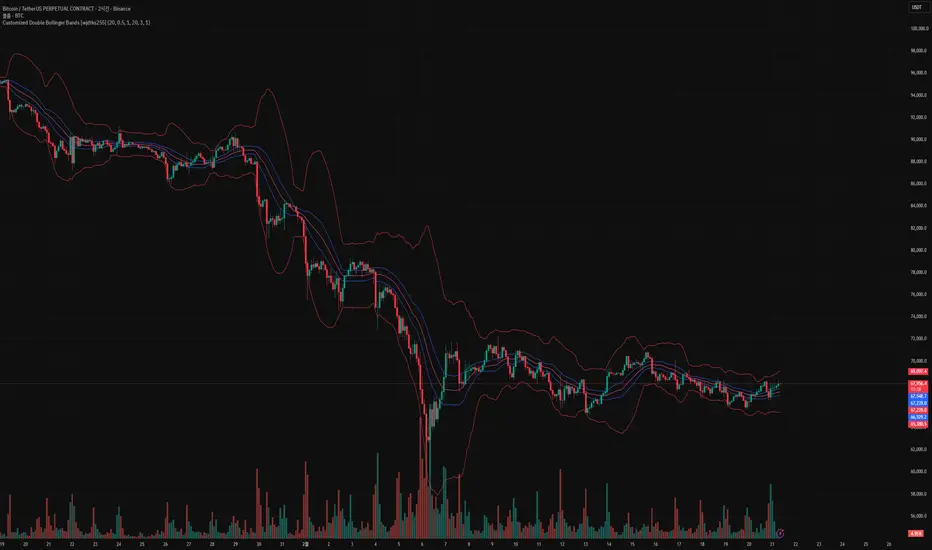
The Customized Double Bollinger Bands is a multi-layered volatility analysis framework. Unlike standard single-band indicators, this script synchronizes two independent volatility engines to identify both the "Value Area" (Band 1) and "Extreme Volatility Zones" (Band 2) simultaneously on a single interface.
■ Implementation & Logic
Dual-Deviation Synchronization: The script calculates two distinct standard deviation layers ($StdDev_{0.5}$ and $StdDev_{3.0}$) to provide a high-fidelity view of price distribution.
Dynamic Range Compression: By comparing the gap between the Blue (Inner) and Red (Outer) bands, traders can visually identify "Squeeze" and "Expansion" phases with institutional-grade precision.
■ Key Features
Fully Customizable Layers: Independent control over 'Length', 'StdDev', and 'Color' for both band sets allows for adaptive strategies across different timeframes.
Optimized Visual Clarity: Designed with specific line-width controls to ensure the chart remains readable even during high-volatility spikes.
■ Trading Method
Core Trend: Use the Inner Blue Bands ($0.5$ StdDev) to track the primary trend strength.
Reversal Watch: Use the Outer Red Bands ($3.0$ StdDev) as exhaustion points where price is statistically overextended.
The Customized Double Bollinger Bands is a multi-layered volatility analysis framework. Unlike standard single-band indicators, this script synchronizes two independent volatility engines to identify both the "Value Area" (Band 1) and "Extreme Volatility Zones" (Band 2) simultaneously on a single interface.
■ Implementation & Logic
Dual-Deviation Synchronization: The script calculates two distinct standard deviation layers ($StdDev_{0.5}$ and $StdDev_{3.0}$) to provide a high-fidelity view of price distribution.
Dynamic Range Compression: By comparing the gap between the Blue (Inner) and Red (Outer) bands, traders can visually identify "Squeeze" and "Expansion" phases with institutional-grade precision.
■ Key Features
Fully Customizable Layers: Independent control over 'Length', 'StdDev', and 'Color' for both band sets allows for adaptive strategies across different timeframes.
Optimized Visual Clarity: Designed with specific line-width controls to ensure the chart remains readable even during high-volatility spikes.
■ Trading Method
Core Trend: Use the Inner Blue Bands ($0.5$ StdDev) to track the primary trend strength.
Reversal Watch: Use the Outer Red Bands ($3.0$ StdDev) as exhaustion points where price is statistically overextended.
Open-source script
In true TradingView spirit, the creator of this script has made it open-source, so that traders can review and verify its functionality. Kudos to the author! While you can use it for free, remember that republishing the code is subject to our House Rules.

Disclaimer
The information and publications are not meant to be, and do not constitute, financial, investment, trading, or other types of advice or recommendations supplied or endorsed by TradingView. Read more in the Terms of Use.
Open-source script
In true TradingView spirit, the creator of this script has made it open-source, so that traders can review and verify its functionality. Kudos to the author! While you can use it for free, remember that republishing the code is subject to our House Rules.
Disclaimer
The information and publications are not meant to be, and do not constitute, financial, investment, trading, or other types of advice or recommendations supplied or endorsed by TradingView. Read more in the Terms of Use.