Updated
Earnings Alpha Screener Pro [LevelUp]
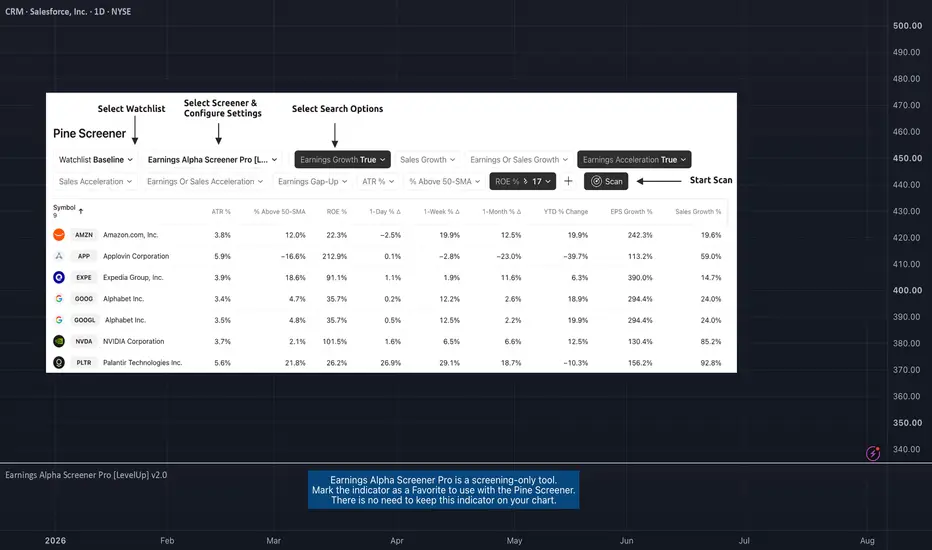
Earnings drive institutional accumulation. With the LevelUp earnings screener you can search for earnings/sales growth, earnings/sales acceleration, as well as earnings gap-ups. This screener was designed to surface stocks with the highest potential for sustained upward price moves.
🔹 Earnings & Sales Growth
Earnings and sales growth measures how fast a company's EPS and revenue are expanding compared to the same quarter one year earlier (year-over-year, or YoY). Comparing against the same quarter last year - rather than the immediately prior quarter - strips out normal seasonal swings (e.g., a retailer's Q4-to-Q1 drop-off) so the number reflects real business momentum rather than the calendar.
This is the core screening criterion behind CANSLIM-style growth investing popularized by IBD/William O'Neil: strong, sustained quarterly EPS and sales growth versus a year ago is one of the most consistent traits shared by big winning stocks before their major price moves.
Key Concepts
▪ Quarterly EPS Growth: The percentage change in EPS versus the same quarter one year ago. IBD/CANSLIM convention looks for growth of 20-25%+ (with the biggest winners often posting 50%+ or more).
▪ Quarterly Sales Growth: The percentage change in revenue versus the same quarter one year ago, typically screened for 15-20%+ to confirm that earnings growth is backed by real demand, not just cost-cutting or buybacks.
▪ Consecutive-Quarter Requirement: Both growth checks can require the threshold to be met for more than one consecutive quarter, filtering out one-off beats in favor of a sustained growth trend.
🔹 Earnings & Sales Growth: Why It Matters to Traders
▪ Institutional-Grade Filter: Consistently strong YoY growth is the same screen large funds run before building positions, so growth stocks that clear this bar are more likely to already be attracting institutional sponsorship.
Example: A stock posting 60%+ EPS growth for two straight quarters versus a year ago is far more likely to show up on professional growth screens than one with a single strong quarter.
▪ Separates Signal from Seasonal Noise: Because the comparison is YoY rather than sequential quarter-over-quarter, a seasonal business won't get incorrectly flagged as "decelerating" during its normal slow season, or falsely flagged as "accelerating" coming out of it.
▪ Confirms the Growth Story Is Broad-Based: Requiring both EPS and sales growth (rather than EPS alone) helps rule out earnings growth driven purely by margin expansion, cost cuts, or share buybacks with no underlying revenue growth behind it.
🔹 Earnings & Sales Acceleration
Earnings and sales acceleration refers to the increasing rate of year-over-year growth in a company's earnings and revenue over consecutive quarters. It highlights companies that are not only growing but doing so at an accelerating pace, signaling improving financial health and operational momentum. This metric is derived from earnings reports, which detail a company's financial performance.
Key Concepts
▪ Earnings Acceleration: When a company's year-over-year earnings per share (EPS) growth rate increases from one quarter to the next (e.g., EPS growth of 10% one quarter, 15% the next, 20% the quarter after that, each measured against the same quarter a year earlier). It indicates improving profitability, often due to cost efficiencies, margin expansion, and strong demand.
▪ Sales Acceleration: When year-over-year revenue growth rates increase from one quarter to the next (e.g., revenue growth of 5%, then 8%, then 12%, each versus the same quarter a year earlier). This reflects rising demand for products/services and operational efficiency.
▪ Relation to Earnings Reports: Acceleration is calculated by comparing each quarter's year-over-year growth rate to the prior quarter's year-over-year growth rate, so it captures the trend in growth itself, not just growth in absolute terms. It signals fundamental strength when both earnings and sales accelerate simultaneously.
🔹 Earnings & Sales Acceleration: Why It Matters to Traders
▪ Identify High-Potential Stocks: Stocks with accelerating earnings and sales often attract investor attention, as they signal that a company is outperforming expectations and gaining market share. This can lead to sustained price appreciation.
Example: A tech company reporting accelerating EPS and sales growth quarter-over-quarter (each measured versus a year earlier) may see bullish price action as investors bet on continued momentum.
▪ Momentum Trading Opportunities: Acceleration often fuels stock price momentum, especially post-earnings. Traders can ride these trends using technical setups like breakouts or pullbacks.
Example: A stock breaking above a key resistance level after reporting accelerating growth may be a buy signal for swing traders.
▪ Early Indicator of Breakouts: Companies with accelerating fundamentals are more likely to experience price breakouts, as institutional investors (e.g., hedge funds, mutual funds) pile in. Traders can use this to position early.
Example: A retailer with accelerating sales due to strong holiday demand might gap-up post-earnings, offering a breakout trade.
▪ Confirmation of Fundamental Strength: Acceleration validates a company's growth story, reducing the risk of investing in stocks with inconsistent performance. Traders can align technical trades with strong fundamentals.
Example: A biotech with accelerating sales from a new drug launch may sustain a rally, giving traders confidence in long positions.
🔹 Earnings Gap-Up
An earnings gap-up refers to a significant price gap up after an earnings report, reflecting a rapid shift in investor sentiment and perceived value. Ideally, the move is sharp, sustained, and accompanied by high trading volume, signaling a potential trend continuation or reversal.
A gap is the difference between the closing price of a stock on the day before an earnings report and the opening price the next trading day. An earnings gap-up typically exceeds a defined threshold (e.g., 8-10%) and is driven by earnings surprises, guidance changes, or other significant news.
Strong earnings beats, misses, or forward-looking guidance can trigger these gaps. For example, a company reporting higher-than-expected profits or raising guidance might gap-up, while a miss or weak outlook could cause a gap-down.
The gap-up is often accompanied by above-average trading volume, confirming the move's strength. Earnings gap-ups often lead to sustained price movement in the direction of the gap (continuation) or signal a reversal if the gap fills quickly.
🔹 Earnings Gap-Ups: Why They Matter to Traders
▪ Earnings gap-ups often indicate strong momentum. Traders can capitalize on this by entering trades in the direction of the gap (e.g., buying on a gap-up if momentum continues).
Example: If a stock gaps-up 10% after a stellar earnings report and shows high volume, traders might buy, expecting further upside as momentum builds.
▪ Breakout Opportunities: A gap-up through key technical levels (e.g., resistance or support) can signal a breakout. Traders use these gap-ups to identify potential long-term trends.
Example: A stock breaking above a resistance level on an earnings gap-up may continue to rally, offering a setup for swing or position traders.
▪ Confirmation of Fundamental Strength/Weakness: An earnings gap-up often reflects a fundamental shift, e.g., strong earnings growth or a major business development. Traders can use this to align technical setups with fundamental catalysts.
Example: A gap-up after a company raises its full-year guidance might signal a long-term buying opportunity.
▪ Risk Management and Stop Losses: Gap-ups provide clear levels for setting stop-loss orders. For instance, traders might place stops at or below the gap-up bar low to protect against a potential reversal.
Example: If a stock gaps-up from $100 to $110 and intraday hits a low of $105, a trader might set a stop at $105 or lower to limit downside risk.
▪ Gap Fill Strategies: Some traders anticipate gaps filling, meaning the stock returns to its pre-gap price. If an earnings gap-up seems overextended (e.g., due to market overreaction), contrarian traders might short a gap-up, anticipating a pullback.
Example: A stock gaps up 15% but lacks volume or follow-through; a trader might short it, expecting the price to retreat.
🔹 Price Extension & Return on Equity
Beyond growth, acceleration, and gap-ups, two additional screener columns help gauge how extended a stock's price is and how efficiently a company generates profit: % Above the 50-SMA and Return on Equity (ROE). Unlike the settings above, these aren't pass/fail criteria configured in the indicator - they're columns available directly in the Pine Screener, which you can sort, display, or filter with your own thresholds.
Key Concepts
▪ % Above the 50-SMA: How far a stock's current price sits above (or below) its 50-day simple moving average, expressed as a percentage. A modest, controlled reading suggests a stock is still in a reasonable buy zone; a stock stretched far above its 50-SMA is historically more prone to a sharp pullback even on strong fundamentals. A negative reading means price has broken below the 50-SMA.
▪ Return on Equity (ROE): How efficiently a company turns shareholder capital into profit, calculated as net income divided by shareholders' equity (most recent fiscal year). IBD/CANSLIM screens commonly look for ROE of 15-17%+ as a sign of a well-run, capital-efficient business.
🔹 % Above the 50-SMA and ROE: Why They Matter to Traders
▪ Avoiding Chasing Extended Stocks: A stock can clear every growth and acceleration filter and still be a poor entry if it's already 20-30%+ above its 50-SMA. Sorting by % Above the 50-SMA helps separate stocks still in a reasonable buy range from those already extended.
Example: Two stocks both pass the earnings growth and acceleration filters, but one sits 5% above its 50-SMA and the other 35% above. The first offers a more favorable risk/reward entry.
▪ Confirming Quality Behind the Growth: Pairing growth criteria with ROE helps separate companies growing profitably from those growing inefficiently or off a weak capital base.
Example: Two companies both posting 30% EPS growth can look identical on a pure growth screen, but the one with a 20% ROE is converting that growth into shareholder value far more efficiently than one with a 5% ROE.
🔹 Screening Examples
Triple Digit Earnings Growth

Earnings and Sales Acceleration

Earnings Gap-Up

🔹 Screening Features - Setting Your Search Criteria

Earnings & Sales Growth
▪ Quarterly EPS Growth ≥ %
The minimum year-over-year EPS growth rate (vs. the same quarter one year ago) required, and how many consecutive quarters must clear that bar.
▪ Quarterly Sales Growth ≥ %
The minimum year-over-year sales growth rate required, and how many consecutive quarters must clear that bar.
▪ Require Positive Current EPS
When enabled, a stock must have a positive EPS in the most recent quarter to pass the EPS growth check. This prevents a negative-to-less-negative swing (e.g., -$0.50 to -$0.25) from being counted as "growth."
Earnings And Sales Acceleration
▪ EPS Acceleration & Sales Acceleration
You can specify between 1 and 4 quarters of year-over-year earnings and/or sales acceleration (each quarter's YoY growth rate higher than the prior quarter's YoY growth rate).
Earnings Gap-Up
▪ Search Range
How many bars back to search for earnings gap-ups, anywhere between 1 and 90 bars.
▪ Last Bar Only
Look only at the last bar for an earnings gap-up. This is useful when screening at the end of a trading day for the most recent price action. When this option is selected, the Search Range setting will be ignored.
▪ Minimum Price % Gap Up From Prior Close
The minimum price gap percentage required to qualify as an earnings gap-up.
▪ Minimum Volume % Change Over Average
The minimum volume increase, relative to the 50-day average, required to confirm an earnings gap-up.
▪ Require Positive Surprise
When enabled, the screener will only return results where the company reported earnings that exceeded analyst estimates. The minimum surprise percentage can be configured to filter out marginal beats and focus on meaningful outperformance.
▪ Require Closing Range
Specify a minimum closing range (as a percentage of the bar's daily range) to confirm the stock closed near its highs.
▪ Gap-Up Bar Requirement
The gap-up bar can be configured to require one of the following:
- Open Above Prior High - The bar opens above the prior bar's high, ensuring a clean, visible gap with no price overlap between sessions.
- Low Above Prior High - The bar opens above the prior high but allows intraday price action to dip below it. This is a less strict requirement that captures gap-ups with some intraday retracement.
- No Requirement - No gap condition is enforced on the bar itself; only the other configured criteria must be met.
▪ Require Price > Earnings Gap-Up Day Low
Require current price to be above the gap-up bar low. This can help identify stocks showing continued momentum and an upward trend.
🔹 Installation And Usage
▪ Mark this indicator as a Favorite.
▪ Use the Pine Screener to search for stocks.
▪ Save the search results to a watchlist.
▪ View the watchlist in TradingView.
🔹 Earnings & Sales Growth
Earnings and sales growth measures how fast a company's EPS and revenue are expanding compared to the same quarter one year earlier (year-over-year, or YoY). Comparing against the same quarter last year - rather than the immediately prior quarter - strips out normal seasonal swings (e.g., a retailer's Q4-to-Q1 drop-off) so the number reflects real business momentum rather than the calendar.
This is the core screening criterion behind CANSLIM-style growth investing popularized by IBD/William O'Neil: strong, sustained quarterly EPS and sales growth versus a year ago is one of the most consistent traits shared by big winning stocks before their major price moves.
Key Concepts
▪ Quarterly EPS Growth: The percentage change in EPS versus the same quarter one year ago. IBD/CANSLIM convention looks for growth of 20-25%+ (with the biggest winners often posting 50%+ or more).
▪ Quarterly Sales Growth: The percentage change in revenue versus the same quarter one year ago, typically screened for 15-20%+ to confirm that earnings growth is backed by real demand, not just cost-cutting or buybacks.
▪ Consecutive-Quarter Requirement: Both growth checks can require the threshold to be met for more than one consecutive quarter, filtering out one-off beats in favor of a sustained growth trend.
🔹 Earnings & Sales Growth: Why It Matters to Traders
▪ Institutional-Grade Filter: Consistently strong YoY growth is the same screen large funds run before building positions, so growth stocks that clear this bar are more likely to already be attracting institutional sponsorship.
Example: A stock posting 60%+ EPS growth for two straight quarters versus a year ago is far more likely to show up on professional growth screens than one with a single strong quarter.
▪ Separates Signal from Seasonal Noise: Because the comparison is YoY rather than sequential quarter-over-quarter, a seasonal business won't get incorrectly flagged as "decelerating" during its normal slow season, or falsely flagged as "accelerating" coming out of it.
▪ Confirms the Growth Story Is Broad-Based: Requiring both EPS and sales growth (rather than EPS alone) helps rule out earnings growth driven purely by margin expansion, cost cuts, or share buybacks with no underlying revenue growth behind it.
🔹 Earnings & Sales Acceleration
Earnings and sales acceleration refers to the increasing rate of year-over-year growth in a company's earnings and revenue over consecutive quarters. It highlights companies that are not only growing but doing so at an accelerating pace, signaling improving financial health and operational momentum. This metric is derived from earnings reports, which detail a company's financial performance.
Key Concepts
▪ Earnings Acceleration: When a company's year-over-year earnings per share (EPS) growth rate increases from one quarter to the next (e.g., EPS growth of 10% one quarter, 15% the next, 20% the quarter after that, each measured against the same quarter a year earlier). It indicates improving profitability, often due to cost efficiencies, margin expansion, and strong demand.
▪ Sales Acceleration: When year-over-year revenue growth rates increase from one quarter to the next (e.g., revenue growth of 5%, then 8%, then 12%, each versus the same quarter a year earlier). This reflects rising demand for products/services and operational efficiency.
▪ Relation to Earnings Reports: Acceleration is calculated by comparing each quarter's year-over-year growth rate to the prior quarter's year-over-year growth rate, so it captures the trend in growth itself, not just growth in absolute terms. It signals fundamental strength when both earnings and sales accelerate simultaneously.
🔹 Earnings & Sales Acceleration: Why It Matters to Traders
▪ Identify High-Potential Stocks: Stocks with accelerating earnings and sales often attract investor attention, as they signal that a company is outperforming expectations and gaining market share. This can lead to sustained price appreciation.
Example: A tech company reporting accelerating EPS and sales growth quarter-over-quarter (each measured versus a year earlier) may see bullish price action as investors bet on continued momentum.
▪ Momentum Trading Opportunities: Acceleration often fuels stock price momentum, especially post-earnings. Traders can ride these trends using technical setups like breakouts or pullbacks.
Example: A stock breaking above a key resistance level after reporting accelerating growth may be a buy signal for swing traders.
▪ Early Indicator of Breakouts: Companies with accelerating fundamentals are more likely to experience price breakouts, as institutional investors (e.g., hedge funds, mutual funds) pile in. Traders can use this to position early.
Example: A retailer with accelerating sales due to strong holiday demand might gap-up post-earnings, offering a breakout trade.
▪ Confirmation of Fundamental Strength: Acceleration validates a company's growth story, reducing the risk of investing in stocks with inconsistent performance. Traders can align technical trades with strong fundamentals.
Example: A biotech with accelerating sales from a new drug launch may sustain a rally, giving traders confidence in long positions.
🔹 Earnings Gap-Up
An earnings gap-up refers to a significant price gap up after an earnings report, reflecting a rapid shift in investor sentiment and perceived value. Ideally, the move is sharp, sustained, and accompanied by high trading volume, signaling a potential trend continuation or reversal.
A gap is the difference between the closing price of a stock on the day before an earnings report and the opening price the next trading day. An earnings gap-up typically exceeds a defined threshold (e.g., 8-10%) and is driven by earnings surprises, guidance changes, or other significant news.
Strong earnings beats, misses, or forward-looking guidance can trigger these gaps. For example, a company reporting higher-than-expected profits or raising guidance might gap-up, while a miss or weak outlook could cause a gap-down.
The gap-up is often accompanied by above-average trading volume, confirming the move's strength. Earnings gap-ups often lead to sustained price movement in the direction of the gap (continuation) or signal a reversal if the gap fills quickly.
🔹 Earnings Gap-Ups: Why They Matter to Traders
▪ Earnings gap-ups often indicate strong momentum. Traders can capitalize on this by entering trades in the direction of the gap (e.g., buying on a gap-up if momentum continues).
Example: If a stock gaps-up 10% after a stellar earnings report and shows high volume, traders might buy, expecting further upside as momentum builds.
▪ Breakout Opportunities: A gap-up through key technical levels (e.g., resistance or support) can signal a breakout. Traders use these gap-ups to identify potential long-term trends.
Example: A stock breaking above a resistance level on an earnings gap-up may continue to rally, offering a setup for swing or position traders.
▪ Confirmation of Fundamental Strength/Weakness: An earnings gap-up often reflects a fundamental shift, e.g., strong earnings growth or a major business development. Traders can use this to align technical setups with fundamental catalysts.
Example: A gap-up after a company raises its full-year guidance might signal a long-term buying opportunity.
▪ Risk Management and Stop Losses: Gap-ups provide clear levels for setting stop-loss orders. For instance, traders might place stops at or below the gap-up bar low to protect against a potential reversal.
Example: If a stock gaps-up from $100 to $110 and intraday hits a low of $105, a trader might set a stop at $105 or lower to limit downside risk.
▪ Gap Fill Strategies: Some traders anticipate gaps filling, meaning the stock returns to its pre-gap price. If an earnings gap-up seems overextended (e.g., due to market overreaction), contrarian traders might short a gap-up, anticipating a pullback.
Example: A stock gaps up 15% but lacks volume or follow-through; a trader might short it, expecting the price to retreat.
🔹 Price Extension & Return on Equity
Beyond growth, acceleration, and gap-ups, two additional screener columns help gauge how extended a stock's price is and how efficiently a company generates profit: % Above the 50-SMA and Return on Equity (ROE). Unlike the settings above, these aren't pass/fail criteria configured in the indicator - they're columns available directly in the Pine Screener, which you can sort, display, or filter with your own thresholds.
Key Concepts
▪ % Above the 50-SMA: How far a stock's current price sits above (or below) its 50-day simple moving average, expressed as a percentage. A modest, controlled reading suggests a stock is still in a reasonable buy zone; a stock stretched far above its 50-SMA is historically more prone to a sharp pullback even on strong fundamentals. A negative reading means price has broken below the 50-SMA.
▪ Return on Equity (ROE): How efficiently a company turns shareholder capital into profit, calculated as net income divided by shareholders' equity (most recent fiscal year). IBD/CANSLIM screens commonly look for ROE of 15-17%+ as a sign of a well-run, capital-efficient business.
🔹 % Above the 50-SMA and ROE: Why They Matter to Traders
▪ Avoiding Chasing Extended Stocks: A stock can clear every growth and acceleration filter and still be a poor entry if it's already 20-30%+ above its 50-SMA. Sorting by % Above the 50-SMA helps separate stocks still in a reasonable buy range from those already extended.
Example: Two stocks both pass the earnings growth and acceleration filters, but one sits 5% above its 50-SMA and the other 35% above. The first offers a more favorable risk/reward entry.
▪ Confirming Quality Behind the Growth: Pairing growth criteria with ROE helps separate companies growing profitably from those growing inefficiently or off a weak capital base.
Example: Two companies both posting 30% EPS growth can look identical on a pure growth screen, but the one with a 20% ROE is converting that growth into shareholder value far more efficiently than one with a 5% ROE.
🔹 Screening Examples
Triple Digit Earnings Growth
Earnings and Sales Acceleration
Earnings Gap-Up
🔹 Screening Features - Setting Your Search Criteria
Earnings & Sales Growth
▪ Quarterly EPS Growth ≥ %
The minimum year-over-year EPS growth rate (vs. the same quarter one year ago) required, and how many consecutive quarters must clear that bar.
▪ Quarterly Sales Growth ≥ %
The minimum year-over-year sales growth rate required, and how many consecutive quarters must clear that bar.
▪ Require Positive Current EPS
When enabled, a stock must have a positive EPS in the most recent quarter to pass the EPS growth check. This prevents a negative-to-less-negative swing (e.g., -$0.50 to -$0.25) from being counted as "growth."
Earnings And Sales Acceleration
▪ EPS Acceleration & Sales Acceleration
You can specify between 1 and 4 quarters of year-over-year earnings and/or sales acceleration (each quarter's YoY growth rate higher than the prior quarter's YoY growth rate).
Earnings Gap-Up
▪ Search Range
How many bars back to search for earnings gap-ups, anywhere between 1 and 90 bars.
▪ Last Bar Only
Look only at the last bar for an earnings gap-up. This is useful when screening at the end of a trading day for the most recent price action. When this option is selected, the Search Range setting will be ignored.
▪ Minimum Price % Gap Up From Prior Close
The minimum price gap percentage required to qualify as an earnings gap-up.
▪ Minimum Volume % Change Over Average
The minimum volume increase, relative to the 50-day average, required to confirm an earnings gap-up.
▪ Require Positive Surprise
When enabled, the screener will only return results where the company reported earnings that exceeded analyst estimates. The minimum surprise percentage can be configured to filter out marginal beats and focus on meaningful outperformance.
▪ Require Closing Range
Specify a minimum closing range (as a percentage of the bar's daily range) to confirm the stock closed near its highs.
▪ Gap-Up Bar Requirement
The gap-up bar can be configured to require one of the following:
- Open Above Prior High - The bar opens above the prior bar's high, ensuring a clean, visible gap with no price overlap between sessions.
- Low Above Prior High - The bar opens above the prior high but allows intraday price action to dip below it. This is a less strict requirement that captures gap-ups with some intraday retracement.
- No Requirement - No gap condition is enforced on the bar itself; only the other configured criteria must be met.
▪ Require Price > Earnings Gap-Up Day Low
Require current price to be above the gap-up bar low. This can help identify stocks showing continued momentum and an upward trend.
🔹 Installation And Usage
▪ Mark this indicator as a Favorite.
▪ Use the Pine Screener to search for stocks.
▪ Save the search results to a watchlist.
▪ View the watchlist in TradingView.
Release Notes
Version 2.0Earnings & Sales Growth
Screen for stocks with earnings and sales growth versus the same quarter one year ago, filtering out seasonal noise so you see real, sustained business momentum rather than calendar effects.
Pro Tip: Use the new growth screening features to search for consecutive quarters of triple-digit earning/sales growth.
% Above the 50-SMA
A new data column showing how far price sits above (or below) the 50-SMA, helping you spot stocks still in a healthy buy zone versus ones already extended and prone to a pullback.
Return on Equity (ROE)
A new data column, ROE measures how efficiently a company turns shareholder capital into profit — a sign of a business that can compound growth efficiently, without needing to raise or dilute new capital to fund it.
Release Notes
Version 2.1▪ Updates to Settings to align with YoY growth and acceleration search criteria.
Available in Paid Space
This indicator is only available to TrendPro Suite — Find Your Edge subscribers. Join to access this and other scripts by LevelUpTools.

Join traders in over 40 countries and LevelUp!
tradingview.com/spaces/LevelUpTools/
tradingview.com/spaces/LevelUpTools/
Disclaimer
The information and publications are not meant to be, and do not constitute, financial, investment, trading, or other types of advice or recommendations supplied or endorsed by TradingView. Read more in the Terms of Use.
Available in Paid Space
This indicator is only available to TrendPro Suite — Find Your Edge subscribers. Join to access this and other scripts by LevelUpTools.
Join traders in over 40 countries and LevelUp!
tradingview.com/spaces/LevelUpTools/
tradingview.com/spaces/LevelUpTools/
Disclaimer
The information and publications are not meant to be, and do not constitute, financial, investment, trading, or other types of advice or recommendations supplied or endorsed by TradingView. Read more in the Terms of Use.