OPEN-SOURCE SCRIPT
Updated Sistema Swing Completo (Konkorde + MAs + Fibo)
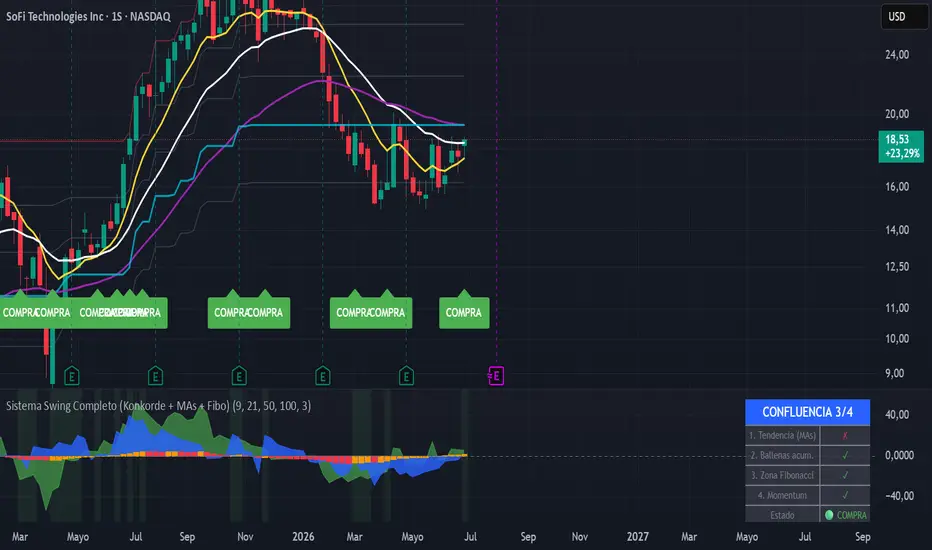
// This source code is subject to the terms of the Mozilla Public License 2.0
//version=6
indicator("Sistema Swing Completo (Konkorde + MAs + Fibo)", overlay=false)
// =====================================================================
// 1. KONCORDE (VOLUMEN DE BALLENAS VS MINORISTAS)
// =====================================================================
// Cálculo de PVI (Minoristas) y NVI (Ballenas)
var float pvi = 1000.0
var float nvi = 1000.0
if bar_index > 0
pvi := volume > volume[1] ? pvi[1] + ((close - close[1]) / close[1]) * pvi[1] : pvi[1]
nvi := volume < volume[1] ? nvi[1] + ((close - close[1]) / close[1]) * nvi[1] : nvi[1]
// Oscilación de Minoristas (Manos Débiles)
pvim = ta.ema(pvi, 15)
pvimax = ta.highest(pvim, 90)
pvimin = ta.lowest(pvim, 90)
minoristas = (pvi - pvim) * 100 / math.max(pvimax - pvimin, 1)
// Oscilación de Ballenas (Manos Fuertes)
nvim = ta.ema(nvi, 15)
nvimax = ta.highest(nvim, 90)
nvimin = ta.lowest(nvim, 90)
ballenas = (nvi - nvim) * 100 / math.max(nvimax - nvimin, 1)
plot(minoristas, color=color.new(color.green, 40), style=plot.style_area, title="Volumen Minorista (Verde)")
plot(ballenas, color=color.new(color.blue, 20), style=plot.style_area, title="Volumen Ballenas (Azul)")
// =====================================================================
// 2. INDICADOR DE MOMENTUM (MACD)
// =====================================================================
[macdLine, signalLine, hist] = ta.macd(close, 12, 26, 9)
escala_momentum = 5 // Multiplicador para igualar la escala del Konkorde visualmente
color_hist = hist > hist[1] ? color.new(color.orange, 0) : color.new(color.red, 0)
plot(hist * escala_momentum, color=color_hist, style=plot.style_columns, title="Momentum (Columnas)")
hline(0, color=color.gray, linestyle=hline.style_dashed)
// =====================================================================
// 3. MEDIAS MÓVILES CONFIGURABLES (Proyectadas al gráfico superior)
// =====================================================================
len1 = input.int(9, title="Longitud EMA 1")
len2 = input.int(21, title="Longitud EMA 2")
len3 = input.int(50, title="Longitud EMA 3")
ema1 = ta.ema(close, len1)
ema2 = ta.ema(close, len2)
ema3 = ta.ema(close, len3)
// El uso de force_overlay=true envía estas líneas a las velas japonesas
plot(ema1, color=color.new(color.yellow, 0), linewidth=2, title="EMA Rápida", force_overlay=true)
plot(ema2, color=color.new(color.white, 0), linewidth=2, title="EMA Media", force_overlay=true)
plot(ema3, color=color.new(color.purple, 0), linewidth=2, title="EMA Lenta", force_overlay=true)
// =====================================================================
// 4. RETROCESO DE FIBONACCI (Proyectado al gráfico superior)
// =====================================================================
fibo_lookback = input.int(100, title="Periodo para Fibonacci")
hh = ta.highest(high, fibo_lookback)
ll = ta.lowest(low, fibo_lookback)
diff = hh - ll
plot(hh, color=color.new(color.red, 50), title="100% (Máximo)", force_overlay=true)
plot(hh - diff * 0.236, color=color.new(color.gray, 60), title="76.4%", force_overlay=true)
plot(hh - diff * 0.382, color=color.new(color.gray, 60), title="61.8%", force_overlay=true)
plot(hh - diff * 0.500, color=color.new(color.aqua, 20), linewidth=2, title="50.0% (Equilibrio)", force_overlay=true)
plot(hh - diff * 0.618, color=color.new(color.gray, 60), title="38.2%", force_overlay=true)
plot(ll, color=color.new(color.green, 50), title="0% (Mínimo)", force_overlay=true)
//version=6
indicator("Sistema Swing Completo (Konkorde + MAs + Fibo)", overlay=false)
// =====================================================================
// 1. KONCORDE (VOLUMEN DE BALLENAS VS MINORISTAS)
// =====================================================================
// Cálculo de PVI (Minoristas) y NVI (Ballenas)
var float pvi = 1000.0
var float nvi = 1000.0
if bar_index > 0
pvi := volume > volume[1] ? pvi[1] + ((close - close[1]) / close[1]) * pvi[1] : pvi[1]
nvi := volume < volume[1] ? nvi[1] + ((close - close[1]) / close[1]) * nvi[1] : nvi[1]
// Oscilación de Minoristas (Manos Débiles)
pvim = ta.ema(pvi, 15)
pvimax = ta.highest(pvim, 90)
pvimin = ta.lowest(pvim, 90)
minoristas = (pvi - pvim) * 100 / math.max(pvimax - pvimin, 1)
// Oscilación de Ballenas (Manos Fuertes)
nvim = ta.ema(nvi, 15)
nvimax = ta.highest(nvim, 90)
nvimin = ta.lowest(nvim, 90)
ballenas = (nvi - nvim) * 100 / math.max(nvimax - nvimin, 1)
plot(minoristas, color=color.new(color.green, 40), style=plot.style_area, title="Volumen Minorista (Verde)")
plot(ballenas, color=color.new(color.blue, 20), style=plot.style_area, title="Volumen Ballenas (Azul)")
// =====================================================================
// 2. INDICADOR DE MOMENTUM (MACD)
// =====================================================================
[macdLine, signalLine, hist] = ta.macd(close, 12, 26, 9)
escala_momentum = 5 // Multiplicador para igualar la escala del Konkorde visualmente
color_hist = hist > hist[1] ? color.new(color.orange, 0) : color.new(color.red, 0)
plot(hist * escala_momentum, color=color_hist, style=plot.style_columns, title="Momentum (Columnas)")
hline(0, color=color.gray, linestyle=hline.style_dashed)
// =====================================================================
// 3. MEDIAS MÓVILES CONFIGURABLES (Proyectadas al gráfico superior)
// =====================================================================
len1 = input.int(9, title="Longitud EMA 1")
len2 = input.int(21, title="Longitud EMA 2")
len3 = input.int(50, title="Longitud EMA 3")
ema1 = ta.ema(close, len1)
ema2 = ta.ema(close, len2)
ema3 = ta.ema(close, len3)
// El uso de force_overlay=true envía estas líneas a las velas japonesas
plot(ema1, color=color.new(color.yellow, 0), linewidth=2, title="EMA Rápida", force_overlay=true)
plot(ema2, color=color.new(color.white, 0), linewidth=2, title="EMA Media", force_overlay=true)
plot(ema3, color=color.new(color.purple, 0), linewidth=2, title="EMA Lenta", force_overlay=true)
// =====================================================================
// 4. RETROCESO DE FIBONACCI (Proyectado al gráfico superior)
// =====================================================================
fibo_lookback = input.int(100, title="Periodo para Fibonacci")
hh = ta.highest(high, fibo_lookback)
ll = ta.lowest(low, fibo_lookback)
diff = hh - ll
plot(hh, color=color.new(color.red, 50), title="100% (Máximo)", force_overlay=true)
plot(hh - diff * 0.236, color=color.new(color.gray, 60), title="76.4%", force_overlay=true)
plot(hh - diff * 0.382, color=color.new(color.gray, 60), title="61.8%", force_overlay=true)
plot(hh - diff * 0.500, color=color.new(color.aqua, 20), linewidth=2, title="50.0% (Equilibrio)", force_overlay=true)
plot(hh - diff * 0.618, color=color.new(color.gray, 60), title="38.2%", force_overlay=true)
plot(ll, color=color.new(color.green, 50), title="0% (Mínimo)", force_overlay=true)
Release Notes
LE SUME UNA TABLA DE INFLUENCIA QUE CUANDO 3/4 INDICADORES SE ALINEAN ES SEÑAL DE COMPRARelease Notes
AGREGUE LOS PUNTOS DE VENTAOpen-source script
In true TradingView spirit, the creator of this script has made it open-source, so that traders can review and verify its functionality. Kudos to the author! While you can use it for free, remember that republishing the code is subject to our House Rules.

Disclaimer
The information and publications are not meant to be, and do not constitute, financial, investment, trading, or other types of advice or recommendations supplied or endorsed by TradingView. Read more in the Terms of Use.
Open-source script
In true TradingView spirit, the creator of this script has made it open-source, so that traders can review and verify its functionality. Kudos to the author! While you can use it for free, remember that republishing the code is subject to our House Rules.
Disclaimer
The information and publications are not meant to be, and do not constitute, financial, investment, trading, or other types of advice or recommendations supplied or endorsed by TradingView. Read more in the Terms of Use.