OPEN-SOURCE SCRIPT
Dynamic ATR v1.0
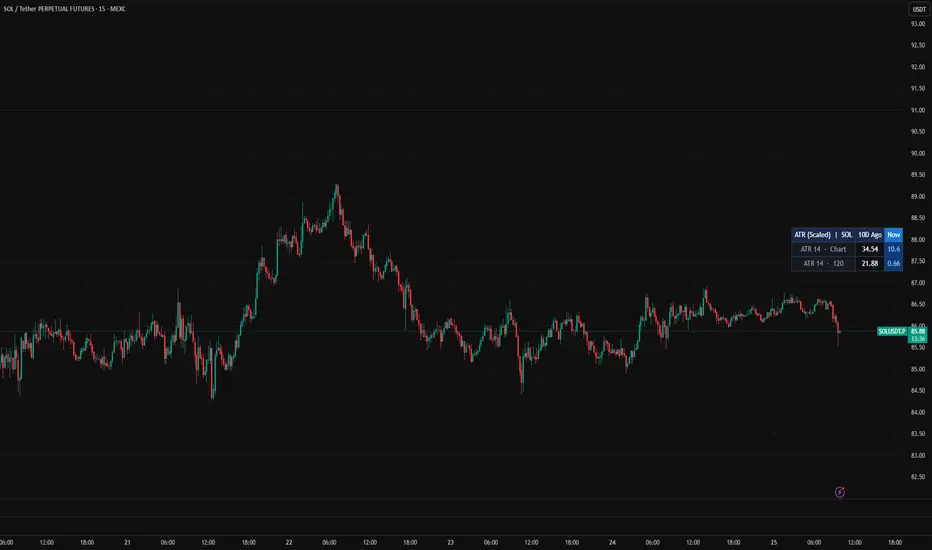
Dynamic ATR displays the Average True Range of any token across two timeframes — the chart timeframe and a configurable higher timeframe (default 2H) — with an…Dynamic ATR displays the Average True Range of any token across two timeframes — the chart timeframe and a configurable higher timeframe (default 2H) — with an optional 0–50 normalization that scales each ATR value relative to its own 360-bar history, making volatility directly comparable across different tokens regardless of their price magnitude. Alongside the current readings, it also shows a snapshot of both ATR values from 10 calendar days ago, giving you a quick sense of whether volatility has expanded or contracted recently. The result is a compact table you can position anywhere on the chart, useful for scanning multiple tokens side by side and spotting which ones are in high or low volatility regimes relative to their own history.
Created by Milad Saberi — April 2026
Created by Milad Saberi — April 2026
Open-source script
In true TradingView spirit, the creator of this script has made it open-source, so that traders can review and verify its functionality. Kudos to the author! While you can use it for free, remember that republishing the code is subject to our House Rules.

Disclaimer
The information and publications are not meant to be, and do not constitute, financial, investment, trading, or other types of advice or recommendations supplied or endorsed by TradingView. Read more in the Terms of Use.
Open-source script
In true TradingView spirit, the creator of this script has made it open-source, so that traders can review and verify its functionality. Kudos to the author! While you can use it for free, remember that republishing the code is subject to our House Rules.
Disclaimer
The information and publications are not meant to be, and do not constitute, financial, investment, trading, or other types of advice or recommendations supplied or endorsed by TradingView. Read more in the Terms of Use.