OPEN-SOURCE SCRIPT
Updated Support and Resistance Institutional Zones [FEELS]
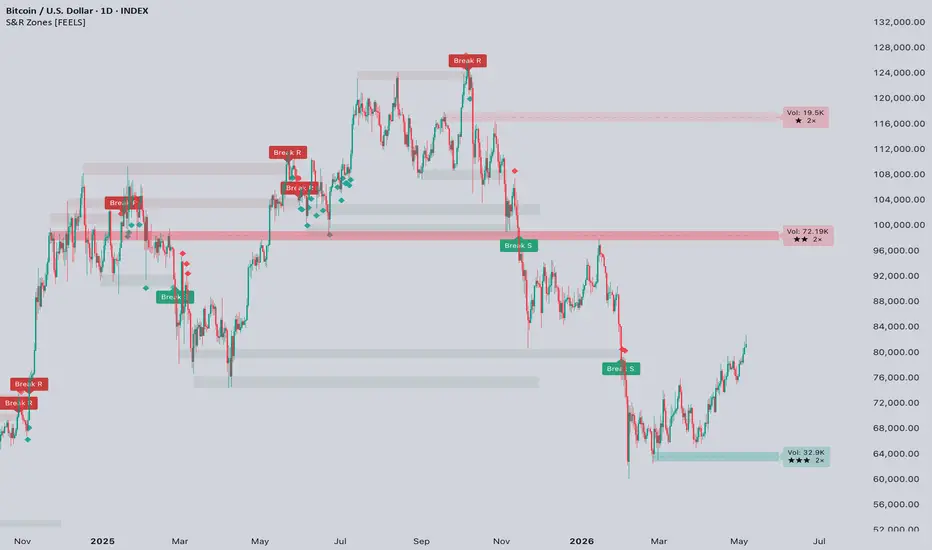
Trade Volume-Weighted, Actionable Zones.
Many traditional support and resistance tools draw lines at every recent high and low. This script takes a different approach. It waits until price has actually used a level multiple times, weights each touch by how much volume and rejection was behind it, and only then draws a zone. The result is fewer levels on your chart, but the ones that do show up have a real mathematical reason to be there. Coupled with a strict, non-repainting signal engine, this tool is designed for serious Price Action traders.

—
🔥 Why This is Different
100% Non-Repainting Signals: Our signal engine operates strictly in real-time. Once a signal (Break, Bounce, Hold) is printed on a closed candle, it stays there forever, ensuring full historical accuracy for your backtesting.
Liquidity Sweep & "Born-Dead" Protection: Sometimes, algorithmic approaches can print false breakout signals if a zone forms retroactively during a massive price drop. We built a custom "Live Break" memory engine that verifies if the price was actually above/below the zone before the break. Furthermore, deep wicks (liquidity sweeps) do not trigger breaks—only solid candle closes do.
Volume & Rejection Weighting: Not all levels are created equal. Pivots that fired on heavy volume with long wicks weigh significantly more than quiet pokes. Zones with higher volume automatically become more vivid, while low-volume zones fade into the background.

—
⚙️ How It Works Under the Hood
The script collects confirmed pivots – both highs and lows – and groups them into clusters by price proximity. It uses a temporal spacing rule that prevents tight, standard consolidations from artificially inflating a single zone.
Older pivots gradually decay in influence, ensuring the active zones reflect what is actually relevant to current price action. The top zones by weighted strength are kept and ranked relative to each other.
—
📊 Reading the Chart
★ to ★★★ – The relative strength of the zone vs. other zones currently visible.
2× / 4× / 7× – The number of qualifying touches the zone has accumulated.
Vol: 72.19K – The cumulative volume of all pivots that built this zone.
Color intensity – Vividness scales with volume; highly transparent, faded zones are weak levels you can mostly ignore.

—
🎯 Strength Presets
Most users do not want to tune pivot parameters manually. The preset selector handles this in one click:
Local — Short pivots, tight zones. Use on intraday for scalping levels.
Swing (Default) — Balanced. Works incredibly well on most timeframes.
Major — Long pivots, wide zones. Surfaces the macro structure of the asset.
Custom — Full manual control over pivot length, tolerance, and spacing. Note: You can switch presets without losing the chart's other visual settings.
—
🚥 Active vs. Broken vs. Dropped Zones
There are three states a zone can be in:
Active: Currently respected by price. Drawn in your chosen support or resistance color.
Confirmed broken: Price closed through the zone with conviction. (Optional setting).
Dropped: Disappeared from the active list because newer pivots reorganized the cluster set. (Optional setting). Useful when reviewing why a past signal fired.
Both broken types are off by default for a clean chart. Toggle them on to study how zones evolved or to backtest signal context.
—
⚡ Optional Signals
The script can mark four types of price reactions. All are off by default – turn on what fits your style:
Successful test: A circle below or above the bar when price tests an active zone and closes back in the rejection direction.
Retest: A diamond when price returns to a previously broken zone within the retest window and reacts off it. The classic broken-resistance-becomes-support play.
Zone reaction marks: A small diamond when price touches a zone and holds without closing through. Bold Break R / Break S text labels appear only when a zone is genuinely broken on close.
RSI filter: An extra confirmation gate. Bullish signals only fire on RSI oversold; bearish only on overbought. Reduces signals to higher-conviction setups.
—
🔔 Alerts
Eight precise alert conditions are exposed for automated trading or notifications:
Resistance touched / Support touched
Resistance broken / Support broken
Successful support test / Successful resistance test
Bullish retest / Bearish retest
New pivot confirmed
Set them through the standard TradingView alert dialog – the conditions appear directly in the dropdown.
—
💡 Pro Tips
No Volume? No Problem: On low-liquidity assets or indices without volume data, zones still build correctly using the wick and structure components. Volume coloring will be uniform, but everything else works flawlessly.
Clean the Clutter: If the chart looks crowded, lower "Active zones per side" to 3-4, or increase "Hide zones farther than (%)" to filter out distant zones.
Fast Timeframes: On 1m or 5m charts, switch the preset to Local and lower the Cooldown bars if you trade off rapid bounce signals.
Relative Strength: Strength is a relative measure within the visible zones, not an absolute score. ★★★ on a quiet, ranging chart is not the same as ★★★ on a high-volume, trending one.
This script is open-source. If you build something interesting on top of it, please reference where the original idea came from.
Disclaimer: Not financial advice. Always backtest before risking capital.
Many traditional support and resistance tools draw lines at every recent high and low. This script takes a different approach. It waits until price has actually used a level multiple times, weights each touch by how much volume and rejection was behind it, and only then draws a zone. The result is fewer levels on your chart, but the ones that do show up have a real mathematical reason to be there. Coupled with a strict, non-repainting signal engine, this tool is designed for serious Price Action traders.
—
🔥 Why This is Different
100% Non-Repainting Signals: Our signal engine operates strictly in real-time. Once a signal (Break, Bounce, Hold) is printed on a closed candle, it stays there forever, ensuring full historical accuracy for your backtesting.
Liquidity Sweep & "Born-Dead" Protection: Sometimes, algorithmic approaches can print false breakout signals if a zone forms retroactively during a massive price drop. We built a custom "Live Break" memory engine that verifies if the price was actually above/below the zone before the break. Furthermore, deep wicks (liquidity sweeps) do not trigger breaks—only solid candle closes do.
Volume & Rejection Weighting: Not all levels are created equal. Pivots that fired on heavy volume with long wicks weigh significantly more than quiet pokes. Zones with higher volume automatically become more vivid, while low-volume zones fade into the background.
—
⚙️ How It Works Under the Hood
The script collects confirmed pivots – both highs and lows – and groups them into clusters by price proximity. It uses a temporal spacing rule that prevents tight, standard consolidations from artificially inflating a single zone.
Older pivots gradually decay in influence, ensuring the active zones reflect what is actually relevant to current price action. The top zones by weighted strength are kept and ranked relative to each other.
—
📊 Reading the Chart
★ to ★★★ – The relative strength of the zone vs. other zones currently visible.
2× / 4× / 7× – The number of qualifying touches the zone has accumulated.
Vol: 72.19K – The cumulative volume of all pivots that built this zone.
Color intensity – Vividness scales with volume; highly transparent, faded zones are weak levels you can mostly ignore.
—
🎯 Strength Presets
Most users do not want to tune pivot parameters manually. The preset selector handles this in one click:
Local — Short pivots, tight zones. Use on intraday for scalping levels.
Swing (Default) — Balanced. Works incredibly well on most timeframes.
Major — Long pivots, wide zones. Surfaces the macro structure of the asset.
Custom — Full manual control over pivot length, tolerance, and spacing. Note: You can switch presets without losing the chart's other visual settings.
—
🚥 Active vs. Broken vs. Dropped Zones
There are three states a zone can be in:
Active: Currently respected by price. Drawn in your chosen support or resistance color.
Confirmed broken: Price closed through the zone with conviction. (Optional setting).
Dropped: Disappeared from the active list because newer pivots reorganized the cluster set. (Optional setting). Useful when reviewing why a past signal fired.
Both broken types are off by default for a clean chart. Toggle them on to study how zones evolved or to backtest signal context.
—
⚡ Optional Signals
The script can mark four types of price reactions. All are off by default – turn on what fits your style:
Successful test: A circle below or above the bar when price tests an active zone and closes back in the rejection direction.
Retest: A diamond when price returns to a previously broken zone within the retest window and reacts off it. The classic broken-resistance-becomes-support play.
Zone reaction marks: A small diamond when price touches a zone and holds without closing through. Bold Break R / Break S text labels appear only when a zone is genuinely broken on close.
RSI filter: An extra confirmation gate. Bullish signals only fire on RSI oversold; bearish only on overbought. Reduces signals to higher-conviction setups.
—
🔔 Alerts
Eight precise alert conditions are exposed for automated trading or notifications:
Resistance touched / Support touched
Resistance broken / Support broken
Successful support test / Successful resistance test
Bullish retest / Bearish retest
New pivot confirmed
Set them through the standard TradingView alert dialog – the conditions appear directly in the dropdown.
—
💡 Pro Tips
No Volume? No Problem: On low-liquidity assets or indices without volume data, zones still build correctly using the wick and structure components. Volume coloring will be uniform, but everything else works flawlessly.
Clean the Clutter: If the chart looks crowded, lower "Active zones per side" to 3-4, or increase "Hide zones farther than (%)" to filter out distant zones.
Fast Timeframes: On 1m or 5m charts, switch the preset to Local and lower the Cooldown bars if you trade off rapid bounce signals.
Relative Strength: Strength is a relative measure within the visible zones, not an absolute score. ★★★ on a quiet, ranging chart is not the same as ★★★ on a high-volume, trending one.
This script is open-source. If you build something interesting on top of it, please reference where the original idea came from.
Disclaimer: Not financial advice. Always backtest before risking capital.
Release Notes
Update v1.1Added:
– Scalp preset for 1-5m timeframes (tighter pivots, faster signals)
– Hardened against runtime errors on long-history charts via max_bars_back
declaration and additional safety guards on historical bar references
Fixed:
– "Historical buffer's limit" runtime error on charts with many bars
Release Notes
Update v1.2Two changes in this release:
1. The optional RSI filter has been removed from the signal layer. All bounce,
retest, and break signals are now produced from the script's own zone state
and raw price action. The script no longer references any external indicator.
ATR(50) and SMA(volume, 50) remain inside the engine as a volatility scale
and a volume normalization baseline. They are not signals on their own and
they are not plotted. The "Filter signals with RSI" toggle and its three
related inputs no longer appear in the settings panel.
2. The notes below expand on the methodology that was only described at a
high level in the original publication: the per-pivot weighting formula,
the way clusters become zones, how the signal layer connects to the zone
engine, and the exact rule used to confirm a break.
HOW A ZONE IS BUILT
A zone is not drawn from every recent high or low. The script collects
confirmed pivothigh and pivotlow points and assigns each one a composite
weight before deciding whether the cluster they form is worth keeping.
For each pivot:
weight = (1 + 0.5 * volume_ratio + 0.5 * wick_ratio) * decay(age)
volume_ratio = pivot bar volume / SMA(volume, 50). Bars with above-average
participation contribute more.
wick_ratio = rejection wick length / ATR(50). A long wick into a level
is stronger evidence of rejection than a quiet poke. ATR is
used to make the wick measurement scale-invariant across
assets and timeframes.
decay(age) = 1 / (1 + age_in_bars / 200). Older pivots gradually lose
influence so active zones reflect current price behavior.
The constant 1 in the numerator gives every pivot a baseline weight
regardless of volume or wick presence, and the 0.5 multipliers keep neither
factor from dominating the score. This specific combination of volume,
ATR-scaled wick rejection, and time decay folded into a single weighting
score is the originality claim of this script.
CLUSTERING, CENTER, AND RANKING
After weights are computed, pivots are grouped into clusters by price
proximity. Two pivots join the same cluster if their price distance is
within clusterTol * ATR(50). A minSpacing rule in bars prevents tight
intraday consolidations from inflating the touch count of a single level.
A cluster becomes a zone only after it has at least minTouches qualifying
pivots.
For each surviving cluster the script computes a weighted average price:
center = Σ(price_i * weight_i) / Σ(weight_i)
The denominator Σ(weight_i) becomes the cluster's relative strength score.
Zones are ranked by this score and the top N per side are kept active. The
star rating shown on the chart is this score normalized against the
strongest active zone visible.
HOW THE COMPONENTS WORK TOGETHER
There is one zone engine in the script. Everything else reads from it:
pivot detected
→ pivot gets a composite weight
→ pivot joins or seeds a cluster
→ cluster's weighted center becomes a Zone object
→ Zone strength score drives its rank, label, and color intensity
→ Zone state (alive, broken, dropped) feeds alerts and signal markers
The bounce, retest, hold, and break markers in the optional signal layer
all read directly from these Zone objects. There is no parallel signal
engine and no second indicator running underneath. This is why removing
the RSI gate did not require any change to the core logic: RSI was a
confirmation layer on top of a signal system that was already complete
on its own.
THE LIVE BREAK RULE
A close beyond a zone's edge is not enough to mark the break as valid.
The script checks the previous bar:
resistance break: close[1] <= top AND close > top
support break: close[1] >= bot AND close < bot
This filters out the case where a cluster forms retroactively in the
middle of a long candle that has already passed through the level.
Without this check, a freshly built zone could print a break label on
the same bar it was created, which is misleading. Wick-only piercings
never trigger a break.
Open-source script
In true TradingView spirit, the creator of this script has made it open-source, so that traders can review and verify its functionality. Kudos to the author! While you can use it for free, remember that republishing the code is subject to our House Rules.

💰Free Channel — t.me/FeelsStrategy
🤵For more info contact — t.me/VolodymyrFeels
🔗 Links — feelsstrategy.com/links
🤵For more info contact — t.me/VolodymyrFeels
🔗 Links — feelsstrategy.com/links
Disclaimer
The information and publications are not meant to be, and do not constitute, financial, investment, trading, or other types of advice or recommendations supplied or endorsed by TradingView. Read more in the Terms of Use.
Open-source script
In true TradingView spirit, the creator of this script has made it open-source, so that traders can review and verify its functionality. Kudos to the author! While you can use it for free, remember that republishing the code is subject to our House Rules.
💰Free Channel — t.me/FeelsStrategy
🤵For more info contact — t.me/VolodymyrFeels
🔗 Links — feelsstrategy.com/links
🤵For more info contact — t.me/VolodymyrFeels
🔗 Links — feelsstrategy.com/links
Disclaimer
The information and publications are not meant to be, and do not constitute, financial, investment, trading, or other types of advice or recommendations supplied or endorsed by TradingView. Read more in the Terms of Use.