OPEN-SOURCE SCRIPT
Updated MR Probability based on IA MR
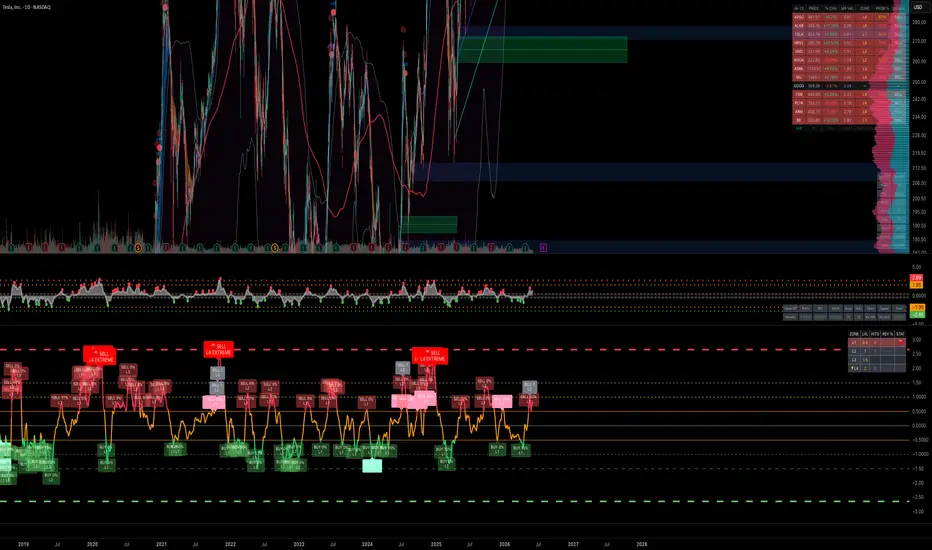
MR Probability Companion
Setup guide, backtest reference, and practical workflow notes for the custom TradingView companion indicator.
Version 3 — Updated with Backtest Engine, Probability Engine, and full input reference.
Purpose: This tool adds a historical probability and backtest layer to the existing IA-Mean-Reversion indicator so you can evaluate signal quality and layer into trades more intelligently.
Best use case: Swing and intraday execution where you want more confidence than a simple buy/sell dot alone can provide.
Contents
1. What this indicator does
2. Setup instructions
3. How probability is calculated
4. Backtest engine — what it measures and how to read it
5. Inputs and what each one does
6. Visual elements and functions
7. Suggested workflow
8. Mobile layout suggestions
9. Important notes and best practices
10. Quick reference
1. What This Indicator Does
The MR Probability Companion is a supporting indicator built to work alongside the paid IA-Mean-Reversion script. It does not generate the original mean reversion logic itself.
Instead, it reads the oscillator plot from that script and converts it into an execution aid with two core engines:
• Probability Engine — calculates how often the oscillator has historically reverted from each threshold level.
• Backtest Engine — tracks every historical signal per tier and reports wins, losses, win rate, and average bars to revert.
In practice: this gives you a way to compare weak, moderate, strong, and extreme signals instead of treating every dot the same — and now shows you the actual historical track record per level.
2. Setup Instructions
1. Add IA-Mean-Reversion [3.6] to your chart.
2. Add the MR Probability Companion script to the same chart.
3. Open the settings for the probability script.
4. Find the input labeled Link to IA-Mean-Reversion [3.6]: Plot.
5. Select the Plot output from the IA-Mean-Reversion indicator in the dropdown.
6. Do not select shapes, buy alert output, sell alert output, or signal markers.
7. After linking correctly, confirm that the oscillator line, labels, tables, or badge begin updating.
Most common mistake: If the script looks blank or probabilities stay empty, the source is almost always linked to the wrong output. The correct source is the IA mean reversion Plot value — not Shapes, not Alerts.
3. How Probability Is Calculated
The Probability Engine studies historical oscillator values over your selected lookback window.
1. It checks when the oscillator reached or crossed a threshold level such as 0.5, 1.0,
1.5, or 2.0.
2. It counts those events as hits.
3. For each hit, it looks forward a set number of bars using the Reversion Time (Bars) setting.
4. If the oscillator returns sufficiently back toward the mean (below 50% of the threshold) within that window, it counts as a successful reversion.
5. The final percentage is the ratio of successful reversions to total hits.
Interpretation: A probability of 78% at Level 3 means that in the sampled history, moves reaching that stretch level reverted within the chosen bar window about 78% of the time.
This is a historical tendency, not a guaranteed forecast.
4. Backtest Engine
The Backtest Engine is a separate, more detailed study that runs alongside the Probability Engine. While the Probability Engine gives you a single percentage, the Backtest Engine gives you the full breakdown per level.
What It Measures
• Every time the oscillator crosses a threshold level (L1, L2, L3, L4), it is counted as a signal.
• The script then checks whether the oscillator reverted back below 50% of that threshold within the Reversion Time (Bars) window.
• If it did, the signal is counted as a win. If not, it is a loss.
• For winning trades, the number of bars it took to revert is tracked and averaged.
Backtest Table Columns
Column Meaning
BACKTEST The level name and threshold value (e.g. L1 · 0.5, L2 · 1.0).
SIGNALS Total number of historical threshold crossings found in the lookback window.
WINS How many of those signals successfully reverted within the bar window.
Shown in green.
LOSSES How many signals failed to revert. Shown in red/pink.
WIN RATE Percentage of wins out of total signals. Color coded: green ≥75%, yellow ≥55%, red below 55%.
AVG BARS Average number of bars it took for winning trades to revert. Helps estimate how long to hold.
How to Use the Backtest Results
• If L3 shows a 78% win rate with an average of 6 bars, that tells you L3 signals on this symbol and timeframe have historically been reliable and relatively fast.
• If L1 shows a 52% win rate, it may not be worth acting on L1 signals alone — wait for L2 or higher.
• Compare win rates across levels to understand which tier gives you the best edge on the current instrument.
• Use AVG BARS to set realistic expectations for how long a trade may take to play out.
Key insight: The backtest table lets you stop guessing which level is "good enough" and instead use actual historical data to decide where to start layering.
5. Inputs and What Each One Does
Input What it does Why it matters
Link to IA-MeanReversion [3.6]:
Plot Reads the oscillator value from the original indicator. Most important setting. Without it, the script cannot function.
Level 1 Threshold Defines the earliest stretch zone. Useful for spotting early entries or first layers.
Level 2 Threshold Defines the moderate stretch zone. Often more meaningful than Level 1 for execution.
Level 3 Threshold Defines the strong stretch zone. Often where higher-conviction opportunities start to appear.
Level 4 Threshold Defines the extreme stretch zone. Useful for exhaustion-style mean reversion setups.
Historical Window
(Bars) Controls how far back the script studies past behavior. Larger windows provide more examples but may reflect older conditions. Default: 200.
Reversion Time
(Bars) Controls how many bars are allowed for a reversion to count as a win. Smaller values are stricter; larger values are more forgiving. Default:
10.
Show % on
Signals Places labels on qualifying signal points. Shows direction, probability, and level directly on the oscillator.
Show Oscillator
Line Displays the live linked mean reversion value as a line. Helps monitor current extension in real time.
Show Full Table Toggles the main analytics table on or off. Useful on desktop when you want deeper stats visible.
Show Backtest
Results Table Toggles the backtest table on or off. Shows wins, losses, win rate, and avg bars per level.
Show Mini Badge
(Mobile) Toggles the compact badge on or off. Best choice for mobile charting or minimal clutter.
Compact Table
Mode Shrinks the table by shortening labels. Helps preserve chart space while keeping core info visible.
Table Position Moves the full analytics table to a different chart area. Lets you avoid covering candles or important indicator zones.
Backtest Table
Position Moves the backtest table independently. Lets you place both tables without overlap.
Table Text Size Changes the table text size. Useful when switching between desktop and mobile screens.
Mini Badge
Position Moves the compact badge independently. Lets you place the badge in the least intrusive area.
6. Visual Elements and Functions
Oscillator Line
This line mirrors the linked IA mean reversion value. Color changes based on direction: red when above L1 (sell-side stretch), green when below negative L1 (buy-side stretch), orange when neutral.
Threshold Lines
Horizontal levels mark the defined stretch zones. L4 lines are drawn with a heavier weight to highlight extreme territory. Positive readings represent sell-side stretch; negative readings represent buy-side stretch.
Signal Labels
When a fresh threshold event occurs, labels appear like BUY 64% L2 or SELL 81% L3.
These summarize direction, historical reversion probability, and the tier level in one glance.
• Buy labels: green tones — brighter green for higher probability.
• Sell labels: red/pink tones — deeper red for higher probability.
Full Analytics Table
Shows the current state of each level including zone name, threshold value, historical hit count, reversion percentage, and active status indicator.
Backtest Results Table
Shows the full historical track record per level: total signals, wins, losses, win rate (color coded), and average bars to revert on winning trades.
Mini Badge
Compact mobile-friendly summary showing active direction, current tier, and probability estimate. Ideal when the full tables take too much chart space.
Alerts
Four built-in alert conditions:
• High probability SELL at L3+ (win rate threshold configurable)
• High probability BUY at L3+
• Extreme SELL at L4
• Extreme BUY at L4
7. Suggested Workflow
If you trade with a top-down process, the indicator fits naturally into that workflow.
1. Use 1D and 4H charts to identify higher-timeframe reversion bias.
2. Watch whether the oscillator is reaching L2, L3, or L4 territory.
3. Check the Backtest Table to see which level has the strongest historical win rate on this symbol and timeframe.
4. Use the Probability label on the signal dot to confirm the current setup quality.
5. Drop to lower timeframes for execution when higher-timeframe context and current level align.
6. Use AVG BARS from the backtest table to set realistic trade duration expectations.
7. Consider smaller initial size at L1 and L2, then add on stronger or more statistically favorable levels.
Key advantage: You no longer need to wait only for the most extreme level every time. If mid-level signals show strong historical win rates, they become actionable layering opportunities too — and now you have the data to back that decision.
8. Mobile Layout Suggestions
• Set Show Full Table = Off for the cleanest chart.
• Set Show Mini Badge = On for a small at-a-glance summary.
• Set Show Backtest Results Table = Off on mobile; review it on desktop when planning trades.
• Use Compact Table Mode if you still want the larger table but need it reduced.
• Move tables and badge using the position settings so they do not block price action.
• Use a smaller text size when charting on a phone.
9. Important Notes and Best Practices
• All percentages and win rates are historical tendencies, not prediction guarantees.
• If the Signals count in the backtest table is very low (under 10), the win rate is less trustworthy due to small sample size.
• Thresholds may need to be adjusted depending on the symbol, timeframe, and volatility regime.
• The script is most useful as a decision-support tool, not a standalone trading system.
• Always combine the probability score and backtest results with market structure, trend context, key levels, and your own risk rules.
• If you change the Historical Window or Reversion Time inputs, the backtest results will update to reflect the new parameters.
• Pine Script has loop limits — if you encounter a "loop too long" error, reduce the Historical Window (Bars) input.
10. Quick Reference
If you want to... Use this
See detailed stats on every level Turn on the full analytics table
See historical win rate per level Turn on the backtest results table
Know how long winning trades typically last Check AVG BARS in the backtest table
Keep the chart clean on mobile Use the mini badge and turn off both tables
Make the display smaller Enable compact mode and reduce table text size
Know if the signal is early or extreme Watch the current tier and threshold lines
React only to stronger setups Use alerts for high-probability L3 and L4 events
Decide which level to start layering at Compare win rates across L1–L4 in the backtest table
Fix blank display or 0% probabilities Re-link the source input to IA-Mean-Reversion
[3.6]: Plot
This document is a concise operating guide for the MR Probability Companion indicator. Version 3 — includes Backtest Engine, updated input reference, and workflow notes.
Setup guide, backtest reference, and practical workflow notes for the custom TradingView companion indicator.
Version 3 — Updated with Backtest Engine, Probability Engine, and full input reference.
Purpose: This tool adds a historical probability and backtest layer to the existing IA-Mean-Reversion indicator so you can evaluate signal quality and layer into trades more intelligently.
Best use case: Swing and intraday execution where you want more confidence than a simple buy/sell dot alone can provide.
Contents
1. What this indicator does
2. Setup instructions
3. How probability is calculated
4. Backtest engine — what it measures and how to read it
5. Inputs and what each one does
6. Visual elements and functions
7. Suggested workflow
8. Mobile layout suggestions
9. Important notes and best practices
10. Quick reference
1. What This Indicator Does
The MR Probability Companion is a supporting indicator built to work alongside the paid IA-Mean-Reversion script. It does not generate the original mean reversion logic itself.
Instead, it reads the oscillator plot from that script and converts it into an execution aid with two core engines:
• Probability Engine — calculates how often the oscillator has historically reverted from each threshold level.
• Backtest Engine — tracks every historical signal per tier and reports wins, losses, win rate, and average bars to revert.
In practice: this gives you a way to compare weak, moderate, strong, and extreme signals instead of treating every dot the same — and now shows you the actual historical track record per level.
2. Setup Instructions
1. Add IA-Mean-Reversion [3.6] to your chart.
2. Add the MR Probability Companion script to the same chart.
3. Open the settings for the probability script.
4. Find the input labeled Link to IA-Mean-Reversion [3.6]: Plot.
5. Select the Plot output from the IA-Mean-Reversion indicator in the dropdown.
6. Do not select shapes, buy alert output, sell alert output, or signal markers.
7. After linking correctly, confirm that the oscillator line, labels, tables, or badge begin updating.
Most common mistake: If the script looks blank or probabilities stay empty, the source is almost always linked to the wrong output. The correct source is the IA mean reversion Plot value — not Shapes, not Alerts.
3. How Probability Is Calculated
The Probability Engine studies historical oscillator values over your selected lookback window.
1. It checks when the oscillator reached or crossed a threshold level such as 0.5, 1.0,
1.5, or 2.0.
2. It counts those events as hits.
3. For each hit, it looks forward a set number of bars using the Reversion Time (Bars) setting.
4. If the oscillator returns sufficiently back toward the mean (below 50% of the threshold) within that window, it counts as a successful reversion.
5. The final percentage is the ratio of successful reversions to total hits.
Interpretation: A probability of 78% at Level 3 means that in the sampled history, moves reaching that stretch level reverted within the chosen bar window about 78% of the time.
This is a historical tendency, not a guaranteed forecast.
4. Backtest Engine
The Backtest Engine is a separate, more detailed study that runs alongside the Probability Engine. While the Probability Engine gives you a single percentage, the Backtest Engine gives you the full breakdown per level.
What It Measures
• Every time the oscillator crosses a threshold level (L1, L2, L3, L4), it is counted as a signal.
• The script then checks whether the oscillator reverted back below 50% of that threshold within the Reversion Time (Bars) window.
• If it did, the signal is counted as a win. If not, it is a loss.
• For winning trades, the number of bars it took to revert is tracked and averaged.
Backtest Table Columns
Column Meaning
BACKTEST The level name and threshold value (e.g. L1 · 0.5, L2 · 1.0).
SIGNALS Total number of historical threshold crossings found in the lookback window.
WINS How many of those signals successfully reverted within the bar window.
Shown in green.
LOSSES How many signals failed to revert. Shown in red/pink.
WIN RATE Percentage of wins out of total signals. Color coded: green ≥75%, yellow ≥55%, red below 55%.
AVG BARS Average number of bars it took for winning trades to revert. Helps estimate how long to hold.
How to Use the Backtest Results
• If L3 shows a 78% win rate with an average of 6 bars, that tells you L3 signals on this symbol and timeframe have historically been reliable and relatively fast.
• If L1 shows a 52% win rate, it may not be worth acting on L1 signals alone — wait for L2 or higher.
• Compare win rates across levels to understand which tier gives you the best edge on the current instrument.
• Use AVG BARS to set realistic expectations for how long a trade may take to play out.
Key insight: The backtest table lets you stop guessing which level is "good enough" and instead use actual historical data to decide where to start layering.
5. Inputs and What Each One Does
Input What it does Why it matters
Link to IA-MeanReversion [3.6]:
Plot Reads the oscillator value from the original indicator. Most important setting. Without it, the script cannot function.
Level 1 Threshold Defines the earliest stretch zone. Useful for spotting early entries or first layers.
Level 2 Threshold Defines the moderate stretch zone. Often more meaningful than Level 1 for execution.
Level 3 Threshold Defines the strong stretch zone. Often where higher-conviction opportunities start to appear.
Level 4 Threshold Defines the extreme stretch zone. Useful for exhaustion-style mean reversion setups.
Historical Window
(Bars) Controls how far back the script studies past behavior. Larger windows provide more examples but may reflect older conditions. Default: 200.
Reversion Time
(Bars) Controls how many bars are allowed for a reversion to count as a win. Smaller values are stricter; larger values are more forgiving. Default:
10.
Show % on
Signals Places labels on qualifying signal points. Shows direction, probability, and level directly on the oscillator.
Show Oscillator
Line Displays the live linked mean reversion value as a line. Helps monitor current extension in real time.
Show Full Table Toggles the main analytics table on or off. Useful on desktop when you want deeper stats visible.
Show Backtest
Results Table Toggles the backtest table on or off. Shows wins, losses, win rate, and avg bars per level.
Show Mini Badge
(Mobile) Toggles the compact badge on or off. Best choice for mobile charting or minimal clutter.
Compact Table
Mode Shrinks the table by shortening labels. Helps preserve chart space while keeping core info visible.
Table Position Moves the full analytics table to a different chart area. Lets you avoid covering candles or important indicator zones.
Backtest Table
Position Moves the backtest table independently. Lets you place both tables without overlap.
Table Text Size Changes the table text size. Useful when switching between desktop and mobile screens.
Mini Badge
Position Moves the compact badge independently. Lets you place the badge in the least intrusive area.
6. Visual Elements and Functions
Oscillator Line
This line mirrors the linked IA mean reversion value. Color changes based on direction: red when above L1 (sell-side stretch), green when below negative L1 (buy-side stretch), orange when neutral.
Threshold Lines
Horizontal levels mark the defined stretch zones. L4 lines are drawn with a heavier weight to highlight extreme territory. Positive readings represent sell-side stretch; negative readings represent buy-side stretch.
Signal Labels
When a fresh threshold event occurs, labels appear like BUY 64% L2 or SELL 81% L3.
These summarize direction, historical reversion probability, and the tier level in one glance.
• Buy labels: green tones — brighter green for higher probability.
• Sell labels: red/pink tones — deeper red for higher probability.
Full Analytics Table
Shows the current state of each level including zone name, threshold value, historical hit count, reversion percentage, and active status indicator.
Backtest Results Table
Shows the full historical track record per level: total signals, wins, losses, win rate (color coded), and average bars to revert on winning trades.
Mini Badge
Compact mobile-friendly summary showing active direction, current tier, and probability estimate. Ideal when the full tables take too much chart space.
Alerts
Four built-in alert conditions:
• High probability SELL at L3+ (win rate threshold configurable)
• High probability BUY at L3+
• Extreme SELL at L4
• Extreme BUY at L4
7. Suggested Workflow
If you trade with a top-down process, the indicator fits naturally into that workflow.
1. Use 1D and 4H charts to identify higher-timeframe reversion bias.
2. Watch whether the oscillator is reaching L2, L3, or L4 territory.
3. Check the Backtest Table to see which level has the strongest historical win rate on this symbol and timeframe.
4. Use the Probability label on the signal dot to confirm the current setup quality.
5. Drop to lower timeframes for execution when higher-timeframe context and current level align.
6. Use AVG BARS from the backtest table to set realistic trade duration expectations.
7. Consider smaller initial size at L1 and L2, then add on stronger or more statistically favorable levels.
Key advantage: You no longer need to wait only for the most extreme level every time. If mid-level signals show strong historical win rates, they become actionable layering opportunities too — and now you have the data to back that decision.
8. Mobile Layout Suggestions
• Set Show Full Table = Off for the cleanest chart.
• Set Show Mini Badge = On for a small at-a-glance summary.
• Set Show Backtest Results Table = Off on mobile; review it on desktop when planning trades.
• Use Compact Table Mode if you still want the larger table but need it reduced.
• Move tables and badge using the position settings so they do not block price action.
• Use a smaller text size when charting on a phone.
9. Important Notes and Best Practices
• All percentages and win rates are historical tendencies, not prediction guarantees.
• If the Signals count in the backtest table is very low (under 10), the win rate is less trustworthy due to small sample size.
• Thresholds may need to be adjusted depending on the symbol, timeframe, and volatility regime.
• The script is most useful as a decision-support tool, not a standalone trading system.
• Always combine the probability score and backtest results with market structure, trend context, key levels, and your own risk rules.
• If you change the Historical Window or Reversion Time inputs, the backtest results will update to reflect the new parameters.
• Pine Script has loop limits — if you encounter a "loop too long" error, reduce the Historical Window (Bars) input.
10. Quick Reference
If you want to... Use this
See detailed stats on every level Turn on the full analytics table
See historical win rate per level Turn on the backtest results table
Know how long winning trades typically last Check AVG BARS in the backtest table
Keep the chart clean on mobile Use the mini badge and turn off both tables
Make the display smaller Enable compact mode and reduce table text size
Know if the signal is early or extreme Watch the current tier and threshold lines
React only to stronger setups Use alerts for high-probability L3 and L4 events
Decide which level to start layering at Compare win rates across L1–L4 in the backtest table
Fix blank display or 0% probabilities Re-link the source input to IA-Mean-Reversion
[3.6]: Plot
This document is a concise operating guide for the MR Probability Companion indicator. Version 3 — includes Backtest Engine, updated input reference, and workflow notes.
Release Notes
minor visual updates Open-source script
In true TradingView spirit, the creator of this script has made it open-source, so that traders can review and verify its functionality. Kudos to the author! While you can use it for free, remember that republishing the code is subject to our House Rules.

Disclaimer
The information and publications are not meant to be, and do not constitute, financial, investment, trading, or other types of advice or recommendations supplied or endorsed by TradingView. Read more in the Terms of Use.
Open-source script
In true TradingView spirit, the creator of this script has made it open-source, so that traders can review and verify its functionality. Kudos to the author! While you can use it for free, remember that republishing the code is subject to our House Rules.
Disclaimer
The information and publications are not meant to be, and do not constitute, financial, investment, trading, or other types of advice or recommendations supplied or endorsed by TradingView. Read more in the Terms of Use.