OPEN-SOURCE SCRIPT
Trading Sessions + IB [midst]
What It Does
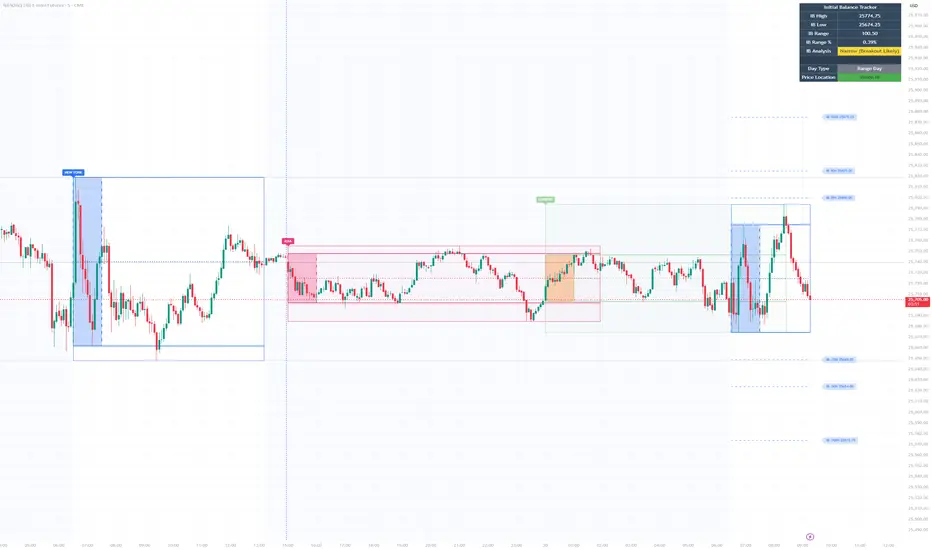
Displays the three major global trading sessions (Asia, London, New York) with Initial Balance (IB) ranges and extension levels. Automatically detects instrument type (ES, NQ, Gold, Silver) and applies correct IB period.
Key Features

Session Boxes: Visual high-to-low range for each session
Initial Balance: First 60 minutes of session range with IB high/mid/low lines
IB Extensions: Automatic calculation of +/-25%, 50%, 100% levels
Live IB Tracker: Real-time statistics table showing IB range, analysis, and market structure
Fully Customizable: Colors, line styles, labels, and display options
Why Use This
Identify key support/resistance levels based on session structure
Track IB breakouts for high-probability trade setups
Use extensions as profit targets or reversal zones
Compare session ranges to gauge volatility
Spot session overlaps for increased liquidity
Default Times (Chicago/Central Time)
Asia: 5:00 PM - 2:00 AM
London: 2:00 AM - 11:00 AM
New York: 7:30 AM - 4:00 PM
How To Use
Add indicator to your chart (works best on 5-15 minute timeframes)
Indicator auto-detects ES, NQ, GC, SI and applies correct 60-minute IB
Watch for price action at IB levels and extensions
Use IB Tracker table for real-time market analysis
Customization
Adjust everything: session times, IB period, colors, line styles, labels, table position. Toggle historical sessions, IB boxes, lines, extensions, and more.
Supported Instruments: ES/MES, NQ/MNQ, GC/MGC (Gold), SI (Silver) - auto-detection included
Displays the three major global trading sessions (Asia, London, New York) with Initial Balance (IB) ranges and extension levels. Automatically detects instrument type (ES, NQ, Gold, Silver) and applies correct IB period.
Key Features
Session Boxes: Visual high-to-low range for each session
Initial Balance: First 60 minutes of session range with IB high/mid/low lines
IB Extensions: Automatic calculation of +/-25%, 50%, 100% levels
Live IB Tracker: Real-time statistics table showing IB range, analysis, and market structure
Fully Customizable: Colors, line styles, labels, and display options
Why Use This
Identify key support/resistance levels based on session structure
Track IB breakouts for high-probability trade setups
Use extensions as profit targets or reversal zones
Compare session ranges to gauge volatility
Spot session overlaps for increased liquidity
Default Times (Chicago/Central Time)
Asia: 5:00 PM - 2:00 AM
London: 2:00 AM - 11:00 AM
New York: 7:30 AM - 4:00 PM
How To Use
Add indicator to your chart (works best on 5-15 minute timeframes)
Indicator auto-detects ES, NQ, GC, SI and applies correct 60-minute IB
Watch for price action at IB levels and extensions
Use IB Tracker table for real-time market analysis
Customization
Adjust everything: session times, IB period, colors, line styles, labels, table position. Toggle historical sessions, IB boxes, lines, extensions, and more.
Supported Instruments: ES/MES, NQ/MNQ, GC/MGC (Gold), SI (Silver) - auto-detection included
Open-source script
In true TradingView spirit, the creator of this script has made it open-source, so that traders can review and verify its functionality. Kudos to the author! While you can use it for free, remember that republishing the code is subject to our House Rules.

Disclaimer
The information and publications are not meant to be, and do not constitute, financial, investment, trading, or other types of advice or recommendations supplied or endorsed by TradingView. Read more in the Terms of Use.
Open-source script
In true TradingView spirit, the creator of this script has made it open-source, so that traders can review and verify its functionality. Kudos to the author! While you can use it for free, remember that republishing the code is subject to our House Rules.
Disclaimer
The information and publications are not meant to be, and do not constitute, financial, investment, trading, or other types of advice or recommendations supplied or endorsed by TradingView. Read more in the Terms of Use.