OPEN-SOURCE SCRIPT
Momentum Adjusted Volatility Trend (MAVT)
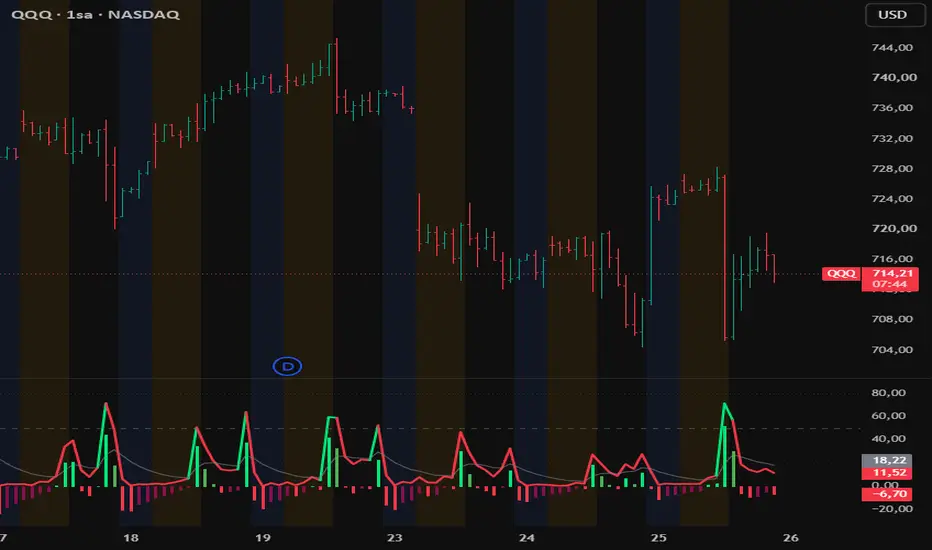
🚀 MOMENTUM ADJUSTED VOLATILITY TREND [MAVT]
The Momentum Adjusted Volatility Trend (MAVT), engineered by gunebak4n, is an advanced multi-dimensional momentum normalization and volatility-filtered trend detection framework designed to isolate high-probability structural trend regimes and momentum expansions.
MAVT is built on the core principle that pure trend momentum cannot be accurately evaluated without cross-referencing volume validation and volatility stress. By structurally unifying absolute price direction (EMA Spread) with a reactive volume ratio, and mathematically penalizing the final output against an adaptive volatility denominator (ATR), the system projects compressed market forces onto a fixed, noise-filtered boundary.
Unlike conventional oscillators that frequently pin at extremes or trigger premature counter-trend signals during highly volatile expansions, MAVT stabilizes trend velocity over a structural lookback window, anchoring the final signal to a highly scannable, institutional trend baseline.
💡 CORE DESIGN PRINCIPLE
🧭 Volatility-Penalized Momentum Convergence
MAVT interprets market trends not merely as an isolated price derivative, but as a dynamic interplay where trend direction must be fueled by volume and structurally discounted by prevailing volatility. True, sustainable trend expansions emerge when momentum and volume accelerate while volatility remains compressed.
🧬 Trend–Volume–Volatility Tri-Factor Model
The system continuously evaluates three interacting structural layers:
Absolute Trend Direction: The raw spread between fast and slow Exponential Moving Averages (EMA).
Volume Confirmation Ratio: Real-time volume scaled against its baseline Moving Average to detect institutional participation.
Volatility Denominator Filter: Average True Range (ATR) utilized as a risk-buffer to compress the indicator's peaks during erratic, overextended market regimes.
The mathematical aggregation of these layers defines the final hybrid trend line.
💡 KEY FEATURES
📊 Adaptive Trend Direction Matrix
The system extracts clean directional bias by calculating the spread between two customizable EMAs. This raw distance represents the velocity of absolute price expansion before entering the normalization matrix.
🧪 Volume Ratio Confirmation Layer
To eliminate low-liquidity market noise and false breakouts, the framework integrates a volume tracking engine. It measures current volume relative to its moving average baseline, ensuring that trend signals are backed by genuine market participation.
🛡️ Non-Linear Volatility Suppressor (ATR Factor)
A key innovation of MAVT is its structural defense against high-risk market conditions. By integrating a normalized Average True Range (ATR) into the denominator of the core formula, the indicator automatically deflates and stabilizes during erratic price spikes, filtering out dangerous trap zones.
📦 Rolling Min-Max Normalization Engine
To completely eliminate indicator drift and nominal floating boundaries, all three core components (Trend, Volume, and Volatility) are dynamically rescaled between 0 and 1 over a customizable lookback period. This forces historically asymmetric data points into a standardized, mathematically stable field.
🧠 Bounded Signal & Directional Logic
The final processed MAVT line oscillates strictly within a 0 to 100 range. The main signal line features a direction-sensitive color architecture that shifts hue instantly based on whether the trend velocity is expanding above or decaying below the critical 50-midline pivot.
🎨 Momentum Strength Histogram
An advanced four-state momentum histogram measures the exact distance between the MAVT Line and its Signal Line. By shifting colors based on directional slope changes, it reveals accelerating and decelerating momentum shifts well before price exhaustion occurs.
🔬 MATHEMATICAL STRUCTURE
Plaintext
Step 1: Raw Components Calculation
• Trend_Raw = EMA(Close, Fast_Period) - EMA(Close, Slow_Period)
• ATR_Value = ATR(ATR_Period)
• Volume_Ratio = Volume / max(SMA(Volume, Volume_MA_Period), 0.000001)
Step 2: Dynamic Min-Max Normalization Function (f_norm)
• Min = Lowest(Source, Lookback_Period)
• Max = Highest(Source, Lookback_Period)
• f_norm(Source) = (Source - Min) / max(Max - Min, 0.000001)
Step 3: Core Combination and Final Scaling
• MAVT_Core = (f_norm(Trend_Raw) * f_norm(Volume_Ratio)) / (1 + f_norm(ATR_Value))
• MAVT_Line = f_norm(MAVT_Core) * 100
• Signal_Line = EMA(MAVT_Line, Signal_Period)
• Histogram = MAVT_Line - Signal_Line
This structural architecture ensures that all cyclical shifts are measured against a fully standardized historical baseline, rather than unstable nominal float boundaries.
🛠️ USAGE FRAMEWORK
1. The Midline Equilibrium Axis (50 Pivot)
Treat the 50 level as the structural axis of market control. MAVT values sustained above 50 dictate a dominant bullish regime, while values compressed below 50 confirm absolute bearish structural control.
2. Multi-State Line Color Interpretation
Monitor the directional line coloration. A bright lime line denotes an expansionary bullish trend above the equilibrium zone, while a bright red line indicates maximum acceleration in a bearish structural breakdown.
3. Advanced Histogram Momentum Scaling
Bright Lime: Positive momentum accelerating (Bullish Expansion).
Dark Green: Positive momentum decaying (Bullish Exhaustion / Consolidation).
Bright Red: Negative momentum accelerating (Bearish Expansion).
Dark Maroon: Negative momentum decaying (Bearish Exhaustion / Short Covering).
4. Symmetrical Institutional Zones
Utilize the 80 (Overbought) and 20 (Oversold) dotted reference levels to identify statistical extremes. When the MAVT Line crosses these thresholds alongside a color shift in the histogram, it highlights high-probability trend reversal or profit-taking boundaries.
⚙️ SYSTEM CHARACTERISTICS
Tri-Factor Synergy: Synchronized integration of trend momentum, volume expansion, and volatility compression.
Fixed-Boundary Architecture: Rolling Min-Max normalization matrix eliminates standard indicator drifting.
High-Conviction Filtering: Mathematical ATR penalty reduces false breakouts during erratic, low-probability market moves.
Four-State Momentum Histogram: Highly visible slope detection for precision entries and exits.
Fully Parameterized Controls: Seamlessly adjustable inputs to match any asset class, from macro indices to highly volatile crypto and forex pairs.
📌 CREDIT
The Momentum Adjusted Volatility Trend (MAVT) is officially developed and published by gunebak4n as a structural momentum normalization and trend velocity detection framework for TradingView.
The system is engineered for traders seeking to identify statistically significant cyclical shifts emerging from multi-factor compression, rather than chasing isolated, noise-heavy price action breakouts.
⚠️ DISCLAIMER
MAVT is a probabilistic analytical model. It does not predict market outcomes or guarantee trading performance. All signals must be interpreted within a disciplined risk management framework and validated with broader institutional market context.
The Momentum Adjusted Volatility Trend (MAVT), engineered by gunebak4n, is an advanced multi-dimensional momentum normalization and volatility-filtered trend detection framework designed to isolate high-probability structural trend regimes and momentum expansions.
MAVT is built on the core principle that pure trend momentum cannot be accurately evaluated without cross-referencing volume validation and volatility stress. By structurally unifying absolute price direction (EMA Spread) with a reactive volume ratio, and mathematically penalizing the final output against an adaptive volatility denominator (ATR), the system projects compressed market forces onto a fixed, noise-filtered boundary.
Unlike conventional oscillators that frequently pin at extremes or trigger premature counter-trend signals during highly volatile expansions, MAVT stabilizes trend velocity over a structural lookback window, anchoring the final signal to a highly scannable, institutional trend baseline.
💡 CORE DESIGN PRINCIPLE
🧭 Volatility-Penalized Momentum Convergence
MAVT interprets market trends not merely as an isolated price derivative, but as a dynamic interplay where trend direction must be fueled by volume and structurally discounted by prevailing volatility. True, sustainable trend expansions emerge when momentum and volume accelerate while volatility remains compressed.
🧬 Trend–Volume–Volatility Tri-Factor Model
The system continuously evaluates three interacting structural layers:
Absolute Trend Direction: The raw spread between fast and slow Exponential Moving Averages (EMA).
Volume Confirmation Ratio: Real-time volume scaled against its baseline Moving Average to detect institutional participation.
Volatility Denominator Filter: Average True Range (ATR) utilized as a risk-buffer to compress the indicator's peaks during erratic, overextended market regimes.
The mathematical aggregation of these layers defines the final hybrid trend line.
💡 KEY FEATURES
📊 Adaptive Trend Direction Matrix
The system extracts clean directional bias by calculating the spread between two customizable EMAs. This raw distance represents the velocity of absolute price expansion before entering the normalization matrix.
🧪 Volume Ratio Confirmation Layer
To eliminate low-liquidity market noise and false breakouts, the framework integrates a volume tracking engine. It measures current volume relative to its moving average baseline, ensuring that trend signals are backed by genuine market participation.
🛡️ Non-Linear Volatility Suppressor (ATR Factor)
A key innovation of MAVT is its structural defense against high-risk market conditions. By integrating a normalized Average True Range (ATR) into the denominator of the core formula, the indicator automatically deflates and stabilizes during erratic price spikes, filtering out dangerous trap zones.
📦 Rolling Min-Max Normalization Engine
To completely eliminate indicator drift and nominal floating boundaries, all three core components (Trend, Volume, and Volatility) are dynamically rescaled between 0 and 1 over a customizable lookback period. This forces historically asymmetric data points into a standardized, mathematically stable field.
🧠 Bounded Signal & Directional Logic
The final processed MAVT line oscillates strictly within a 0 to 100 range. The main signal line features a direction-sensitive color architecture that shifts hue instantly based on whether the trend velocity is expanding above or decaying below the critical 50-midline pivot.
🎨 Momentum Strength Histogram
An advanced four-state momentum histogram measures the exact distance between the MAVT Line and its Signal Line. By shifting colors based on directional slope changes, it reveals accelerating and decelerating momentum shifts well before price exhaustion occurs.
🔬 MATHEMATICAL STRUCTURE
Plaintext
Step 1: Raw Components Calculation
• Trend_Raw = EMA(Close, Fast_Period) - EMA(Close, Slow_Period)
• ATR_Value = ATR(ATR_Period)
• Volume_Ratio = Volume / max(SMA(Volume, Volume_MA_Period), 0.000001)
Step 2: Dynamic Min-Max Normalization Function (f_norm)
• Min = Lowest(Source, Lookback_Period)
• Max = Highest(Source, Lookback_Period)
• f_norm(Source) = (Source - Min) / max(Max - Min, 0.000001)
Step 3: Core Combination and Final Scaling
• MAVT_Core = (f_norm(Trend_Raw) * f_norm(Volume_Ratio)) / (1 + f_norm(ATR_Value))
• MAVT_Line = f_norm(MAVT_Core) * 100
• Signal_Line = EMA(MAVT_Line, Signal_Period)
• Histogram = MAVT_Line - Signal_Line
This structural architecture ensures that all cyclical shifts are measured against a fully standardized historical baseline, rather than unstable nominal float boundaries.
🛠️ USAGE FRAMEWORK
1. The Midline Equilibrium Axis (50 Pivot)
Treat the 50 level as the structural axis of market control. MAVT values sustained above 50 dictate a dominant bullish regime, while values compressed below 50 confirm absolute bearish structural control.
2. Multi-State Line Color Interpretation
Monitor the directional line coloration. A bright lime line denotes an expansionary bullish trend above the equilibrium zone, while a bright red line indicates maximum acceleration in a bearish structural breakdown.
3. Advanced Histogram Momentum Scaling
Bright Lime: Positive momentum accelerating (Bullish Expansion).
Dark Green: Positive momentum decaying (Bullish Exhaustion / Consolidation).
Bright Red: Negative momentum accelerating (Bearish Expansion).
Dark Maroon: Negative momentum decaying (Bearish Exhaustion / Short Covering).
4. Symmetrical Institutional Zones
Utilize the 80 (Overbought) and 20 (Oversold) dotted reference levels to identify statistical extremes. When the MAVT Line crosses these thresholds alongside a color shift in the histogram, it highlights high-probability trend reversal or profit-taking boundaries.
⚙️ SYSTEM CHARACTERISTICS
Tri-Factor Synergy: Synchronized integration of trend momentum, volume expansion, and volatility compression.
Fixed-Boundary Architecture: Rolling Min-Max normalization matrix eliminates standard indicator drifting.
High-Conviction Filtering: Mathematical ATR penalty reduces false breakouts during erratic, low-probability market moves.
Four-State Momentum Histogram: Highly visible slope detection for precision entries and exits.
Fully Parameterized Controls: Seamlessly adjustable inputs to match any asset class, from macro indices to highly volatile crypto and forex pairs.
📌 CREDIT
The Momentum Adjusted Volatility Trend (MAVT) is officially developed and published by gunebak4n as a structural momentum normalization and trend velocity detection framework for TradingView.
The system is engineered for traders seeking to identify statistically significant cyclical shifts emerging from multi-factor compression, rather than chasing isolated, noise-heavy price action breakouts.
⚠️ DISCLAIMER
MAVT is a probabilistic analytical model. It does not predict market outcomes or guarantee trading performance. All signals must be interpreted within a disciplined risk management framework and validated with broader institutional market context.
Open-source script
In true TradingView spirit, the creator of this script has made it open-source, so that traders can review and verify its functionality. Kudos to the author! While you can use it for free, remember that republishing the code is subject to our House Rules.

Disclaimer
The information and publications are not meant to be, and do not constitute, financial, investment, trading, or other types of advice or recommendations supplied or endorsed by TradingView. Read more in the Terms of Use.
Open-source script
In true TradingView spirit, the creator of this script has made it open-source, so that traders can review and verify its functionality. Kudos to the author! While you can use it for free, remember that republishing the code is subject to our House Rules.
Disclaimer
The information and publications are not meant to be, and do not constitute, financial, investment, trading, or other types of advice or recommendations supplied or endorsed by TradingView. Read more in the Terms of Use.