Weinstein Stage Cycle Tracker [MarkitTick]
More exclusive indicators from MarkitTick
Subscribe to MarkitTick for $43.75/month to get exclusive indicators by this author. You pay right on TradingView and can use them on your charts straight away.
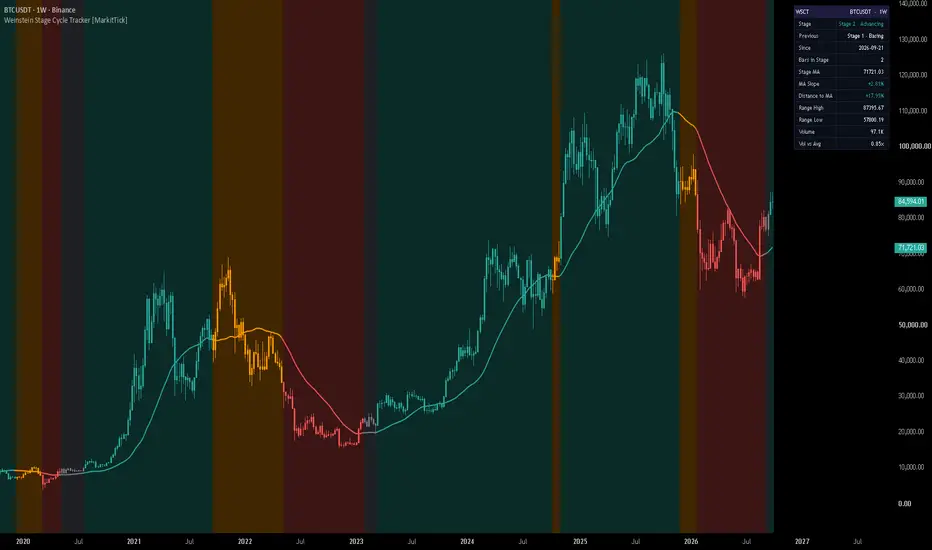
Explore MarkitTick💡 Weinstein Stage Cycle Tracker reads a chart the way Stan Weinstein described the life of a stock in his 1988 book on bull and bear markets. Every market goes through four stages over a full cycle: a base-building phase, an advancing mark-up phase, a topping phase and a declining phase. The tracker puts each bar into one of these four stages using a single stage moving average, how that average is sloping, where price sits against it, and whether price has broken out of its recent trading range. The result shows as a colored moving average, a stage background, colored candles and a compact dashboard, so the trader can see which part of the cycle the market is in and how long it has been there.
The aim is to make stage analysis readable and consistent. Instead of judging a flat or rising average by eye, which changes from one person to the next and from one day to the next, the tracker uses clear, adjustable definitions. It is an analytical tool: it describes the market's current phase and sends an event alert when the phase changes. It does not give entries, stops or targets.
✨ Originality and Utility
Stage analysis is usually applied by looking at a chart and a moving average and deciding which stage fits. This tracker turns that reading into a state machine: a set of four stages with written rules for moving from one stage to another. It does not recolor each bar on its own. Once a stage is established, it holds until one of the defined transition conditions is met. This is what separates it from a simple "price above or below the average" coloring tool, which flips every time price crosses the line and cannot tell a base from a top.
● Why these components work together
Every component answers one question that stage analysis asks:
None of these is added for decoration. Each maps directly onto one part of how the stages are described: during a base, price wanders back and forth across a flattening average; during the mark-up, price is above a rising average and makes new highs, with volume expanding on the breakout; during the top, price stalls and crosses back and forth through the average; during the decline, price falls below a declining average.
🔬 Methodology and Concepts
• Source and optional smoothing
The stage is read from the selected source, the close by default. If Adaptive Smoothing is set to anything other than None, the source is first smoothed with the chosen average (SMA, EMA, WMA, HMA or RMA) over the smoothing length. Everything that follows, including the stage moving average and the breakout test, uses this smoothed series. With None, the raw source is used unchanged.
• The stage moving average
The stage moving average is a simple moving average of the source over the MA Length, 30 bars by default. A simple moving average gives equal weight to every value in its window and moves forward as each new bar replaces the oldest one.
• Slope as a percentage
The slope is the percentage change of the stage average compared with its own value a set number of bars earlier (Slope Lookback, 4 by default). A value above the Flat Slope % threshold (0.5% by default) counts as rising. A value below the negative of that threshold counts as falling. Anything in between counts as flat. Measuring the slope as a percentage keeps the threshold meaningful on any price level, from low-priced symbols to high-priced indices.
• The trading range
The range is the highest high and the lowest low of the bars before the current one, over the Range Lookback (30 bars by default). The current bar is left out so a breakout is always measured against a range that has already formed.
• How the first stage is assigned
At the start of the chart no stage is known. The first stage is assigned only when the picture is clear: a rising average with price above it starts Stage 2, and a falling average with price at or below it starts Stage 4. Until one of these happens, no stage is shown.
• Transition rules
The "had risen during this stage" and "had fallen during this stage" checks are what give the tracker its memory of the cycle. A flat average is only read as a top if it follows a real advance, and only read as a base if it follows a real decline.
• Alert filters
All filters are off by default. HTF Confirmation, Trend Strength and Breakout Volume affect the alerts only; the stage itself, its colors and the dashboard's stage row are never filtered by them. Adaptive Smoothing is different: it changes the series the stage is read from. None of the filters is part of Weinstein's method.
🎨 Visual Guide
• Dashboard
The header shows the short name WSCT, the symbol and the chart timeframe in trader notation such as 4H, 1D or 1W. The rows are:
Since and Bars in Stage show a dash during the very first stage on the chart, because the true start of that stage lies before the data the tracker could read. The Stage row's tooltip explains the warm-up before the first stage appears. Where the symbol's volume is tick volume, a count of trades rather than units traded, the tooltips of the Volume, Vol vs Avg and Breakout Volume rows say so.
Rows that appear only when their filter is on:
📖 How to Use
• Timeframes
The settings panel's own guidance for the MA Length is 30 weeks for investors, 10 weeks for traders, and 30 days on a daily chart for traders. The default of 30 therefore fits a weekly chart for the investor view and a daily chart for the trader view. The default higher timeframe for confirmation is monthly.
• Alerts
Four events fire when the stage changes on a closed bar: Stage 1 Basing, Stage 2 Advancing, Stage 3 Topping and Stage 4 Declining. They are available both as standard alert conditions and through a single alert that sends a JSON message. The JSON message carries the action word, the symbol, the timeframe, a direction (bullish for Stage 2, bearish for Stage 4, neutral for Stages 1 and 3), the stage name, the stage and previous stage numbers, the price, the stage average, the slope percentage and the time. The action words default to stage1, stage2, stage3 and stage4 and can be changed in the Alerts group. These alerts report what happened. They are events, not orders.
• Repainting and live-bar behavior
Stage changes are only alerted on a closed bar. On the bar that is still forming, the stage, the candle and background colors and the dashboard are calculated from the live price and can change until that bar closes, so a stage shown on the live bar is provisional. The higher-timeframe confirmation reads the last completed higher-timeframe bar and never uses a higher-timeframe bar that has not closed yet. Because the stage is built step by step from the first bar the chart loads, the stages at the far left of the chart depend on where the loaded history begins, and a stage is only assigned once the first clear rising or falling condition is met.
⚙️ Inputs and Settings
• Core Settings
• Filters
• Visuals, Dashboard, Alerts and Colors
🔍 Deconstruction of the Underlying Scientific and Academic Framework
• Stage analysis as a market cycle
Stan Weinstein's stage analysis describes the full life of a stock from a bull phase to a bear phase in four observed stages. The base forms while interest is low and volume is light. The mark-up begins with a breakout, a rising average and expanding volume. The top forms when price stops responding to good news and crosses back and forth through its averages. The decline begins when price falls below its prior range and below averages that then turn down. The tracker keeps this sequence and puts it into rules. It uses one stage average, as the book does, and measures the trading range over a fixed lookback where the book reads it by eye.
• The moving average as a smoothing filter
A simple moving average is the plain average of the last n values, with each value weighted equally. It smooths out bar-to-bar noise to show the direction of the trend, at the cost of lag: the longer the length, the longer a major price change takes to show in the average. That trade-off between smoothness and responsiveness is the reason the MA Length and the optional smoothing matter so much to how early or late a stage change appears.
• Slope, rate of change and the flat zone
Comparing the average with its value several bars earlier measures its rate of change over that span. It is the discrete version of a derivative. Readings close to zero are noisy, so the tracker adds a dead band: a symmetric flat zone around zero inside which the slope counts as neither rising nor falling. In signal processing this kind of band is called a dead zone. On its own it does not stop flicker at its edges; what keeps a flat base from being chopped into false advances and declines is the stage memory and the range breakout required to change stage.
• A finite state machine with memory
The four stages and the rules between them form a finite state machine: the next state depends on both the current inputs and the current state. This is why the same combination of a flat average and price near it can mean a base after a decline and a top after an advance. A memoryless classifier, one that looks only at the current bar, cannot make that distinction.
• Breakout of a trading range
Measuring the highest high and lowest low of the preceding bars defines the boundaries of recent price action. A close beyond those boundaries is the objective counterpart of the breakout from a base that marks the start of Stage 2, and of the breakdown below a top that marks the start of Stage 4.
• Trend strength with ADX
The Average Directional Index was introduced by J. Welles Wilder, Jr. in 1978. It is built from positive and negative directional movement, normalized by the true range and smoothed with Wilder's method. It measures the strength of a trend but not its direction. Per TradingView, readings above 25 indicate a strong trend and readings below 20 a weak or absent one. As a filter, it asks that a new advancing or declining stage appear in a market that is actually trending.
• The smoothing options
Each option changes how much noise reaches the stage average and how much lag it adds. None is a neutral choice.
• Volume as confirmation
In the stage framework, volume jumps on the Stage 2 breakout, rises on rallies and falls on dips. Comparing the breakout bar's volume with the average of the bars just before it is a simple relative measure of that expansion. Leaving out bars with no volume keeps the average honest on feeds where many bars report nothing.
• What is not from the book
Weinstein judged a flat moving average and a trading range by eye, so this indicator uses numbers you set instead: Slope Lookback, Flat Slope % and Range Lookback. A breakout or breakdown is judged on the bar's close, not on an intrabar touch. A breakout that fails before the MA turns up returns to Stage 1, which follows the book's note that a false breakout falls back into the trading range; a failed breakdown returns to Stage 3, which is this indicator's own mirror of that rule. At the start of the chart, a stage is assigned only when the MA is clearly rising with price above it (Stage 2) or clearly falling with price at or below it (Stage 4).
• Limitations
⚠️ Disclaimer
All provided scripts and indicators are strictly for educational exploration and must not be interpreted as financial advice or a recommendation to execute trades. We expressly disclaim all liability for any financial losses or damages that may result, directly or indirectly, from the reliance on or application of these tools. Market participation carries inherent risk where past performance never guarantees future returns, leaving all investment decisions and due diligence solely at your own discretion.
The aim is to make stage analysis readable and consistent. Instead of judging a flat or rising average by eye, which changes from one person to the next and from one day to the next, the tracker uses clear, adjustable definitions. It is an analytical tool: it describes the market's current phase and sends an event alert when the phase changes. It does not give entries, stops or targets.
✨ Originality and Utility
Stage analysis is usually applied by looking at a chart and a moving average and deciding which stage fits. This tracker turns that reading into a state machine: a set of four stages with written rules for moving from one stage to another. It does not recolor each bar on its own. Once a stage is established, it holds until one of the defined transition conditions is met. This is what separates it from a simple "price above or below the average" coloring tool, which flips every time price crosses the line and cannot tell a base from a top.
- Memory of the cycle: a stage is judged partly by what came before it. A flattening average after an advance is read as a top (Stage 3). A flattening average after a decline is read as a base (Stage 1). The same flat average means different things depending on the stage it follows, which is the core idea of the cycle.
- Range breakouts decide the big moves: moving into the advancing or declining stage needs price to leave its recent trading range, not just cross the average.
- A dead band around zero slope: small slope readings count as flat, which stops the stage from flickering whenever the average wobbles.
- Optional confirmation filters for the alerts: higher-timeframe agreement, trend strength and breakout volume can be required before a Stage 2 or Stage 4 alert fires (breakout volume applies to Stage 2 only).
- A dashboard that shows the current stage, the previous stage, when the current stage started and how many bars it has lasted.
● Why these components work together
Every component answers one question that stage analysis asks:
- The stage moving average and its slope ask whether the underlying trend is rising, falling or flat.
- The position of price against the average asks which side of the trend price is on.
- The trading range asks whether price has actually escaped the sideways base or top it was in.
- The optional volume, trend-strength and higher-timeframe checks ask whether a new advancing or declining stage has support beyond price alone.
None of these is added for decoration. Each maps directly onto one part of how the stages are described: during a base, price wanders back and forth across a flattening average; during the mark-up, price is above a rising average and makes new highs, with volume expanding on the breakout; during the top, price stalls and crosses back and forth through the average; during the decline, price falls below a declining average.
🔬 Methodology and Concepts
• Source and optional smoothing
The stage is read from the selected source, the close by default. If Adaptive Smoothing is set to anything other than None, the source is first smoothed with the chosen average (SMA, EMA, WMA, HMA or RMA) over the smoothing length. Everything that follows, including the stage moving average and the breakout test, uses this smoothed series. With None, the raw source is used unchanged.
• The stage moving average
The stage moving average is a simple moving average of the source over the MA Length, 30 bars by default. A simple moving average gives equal weight to every value in its window and moves forward as each new bar replaces the oldest one.
• Slope as a percentage
The slope is the percentage change of the stage average compared with its own value a set number of bars earlier (Slope Lookback, 4 by default). A value above the Flat Slope % threshold (0.5% by default) counts as rising. A value below the negative of that threshold counts as falling. Anything in between counts as flat. Measuring the slope as a percentage keeps the threshold meaningful on any price level, from low-priced symbols to high-priced indices.
• The trading range
The range is the highest high and the lowest low of the bars before the current one, over the Range Lookback (30 bars by default). The current bar is left out so a breakout is always measured against a range that has already formed.
- Upside breakout: the source closes above the range high, it is above the stage average, and the average is not falling.
- Downside breakdown: the source closes below the range low, it is below the stage average, and the average is not rising.
• How the first stage is assigned
At the start of the chart no stage is known. The first stage is assigned only when the picture is clear: a rising average with price above it starts Stage 2, and a falling average with price at or below it starts Stage 4. Until one of these happens, no stage is shown.
• Transition rules
- From Stage 1 (basing): a downside breakdown moves to Stage 4, an upside breakout moves to Stage 2, otherwise the base continues.
- From Stage 2 (advancing): a downside breakdown moves to Stage 4. If the average stops rising after having risen at some point during this advance, the stage moves to Stage 3. If the average stops rising while price is not above it, and the average never rose during this stage, the advance is treated as a failed breakout and returns to Stage 1. Otherwise the advance continues.
- From Stage 3 (topping): a downside breakdown moves to Stage 4, an upside breakout returns to Stage 2, otherwise the top continues.
- From Stage 4 (declining): an upside breakout moves to Stage 2. If the average stops falling after having fallen at some point during this decline, the stage moves to Stage 1. If the average stops falling while price is not below it, and the average never fell during this stage, the stage moves to Stage 3. Otherwise the decline continues.
The "had risen during this stage" and "had fallen during this stage" checks are what give the tracker its memory of the cycle. A flat average is only read as a top if it follows a real advance, and only read as a base if it follows a real decline.
• Alert filters
All filters are off by default. HTF Confirmation, Trend Strength and Breakout Volume affect the alerts only; the stage itself, its colors and the dashboard's stage row are never filtered by them. Adaptive Smoothing is different: it changes the series the stage is read from. None of the filters is part of Weinstein's method.
- HTF Confirmation: a simpler rule than the chart's stage logic is applied on a higher timeframe and read from the last completed higher-timeframe bar. The book has no higher-timeframe confirmation rule; the closest idea in it is staying in harmony with the long-term trend. A rising average with price above it counts as bullish, a falling average with price at or below it counts as bearish, and anything else is neutral. A Stage 2 alert then needs a bullish higher timeframe, and a Stage 4 alert needs a bearish one.
- Trend Strength Filter: uses ADX, from J. Welles Wilder's Directional Movement system, which measures how strong a trend is without saying which direction it points. The ADX of the previous bar must be at or above the threshold for a Stage 2 or Stage 4 alert.
- Breakout Volume: the breakout bar's volume must be at least the chosen multiple of the average volume of the bars just before it. Only bars that carry volume enter that average. On a symbol that reports no volume at all, the check is skipped and the dashboard says so.
🎨 Visual Guide
- Stage MA: a line two pixels wide that takes the color of the current stage. Gray is Stage 1 (basing), teal is Stage 2 (advancing), orange is Stage 3 (topping) and red is Stage 4 (declining). Before any stage is established, the line is drawn in the Stage 1 gray.
- Stage Background: a light tint behind the price bars in the color of the current stage. Its strength is set by Background Transparency, 75 by default. No tint is drawn before the first stage is established.
- Candle Coloring: each candle, including its body, wick and border, is painted in its stage color, so the whole price history reads as colored blocks of basing, advancing, topping and declining. Before the first stage is established, candles keep their normal chart colors.
• Dashboard
The header shows the short name WSCT, the symbol and the chart timeframe in trader notation such as 4H, 1D or 1W. The rows are:
- Stage: the current stage and its name, shown in teal for Stage 2, red for Stage 4, and in the text color for Stages 1 and 3.
- Previous: the stage before the current one.
- Since: the date the current stage began, in the exchange's time zone.
- Bars in Stage: how many bars the current stage has lasted.
- Stage MA: the current value of the stage average.
- MA Slope: the slope percentage, teal when rising, red when falling.
- Distance to MA: how far the source is above or below the average, as a percentage, teal above and red below.
- Range High and Range Low: the edges of the trading range used for breakouts.
- Volume: the current bar's volume, shortened with K, M or B.
- Vol vs Avg: current volume as a multiple of its average over the Volume Avg Length. Only bars that carry volume enter that average; with none, the row shows a dash.
Since and Bars in Stage show a dash during the very first stage on the chart, because the true start of that stage lies before the data the tracker could read. The Stage row's tooltip explains the warm-up before the first stage appears. Where the symbol's volume is tick volume, a count of trades rather than units traded, the tooltips of the Volume, Vol vs Avg and Breakout Volume rows say so.
Rows that appear only when their filter is on:
- HTF Bias: Bullish, Bearish or Neutral, with the higher timeframe, or "Skipped · below chart TF" if the chosen timeframe is lower than the chart's.
- Trend Strength: the previous bar's ADX as a ten-block bar with its value, colored by its share of 100: teal from 66, amber from 33 to 65, red below 33.
- Smoothing: the smoothing method and its length.
- Breakout Volume: Pass or Fail with the current ratio, or "Skipped · no volume" on a warning-colored row.
📖 How to Use
- Start with the stage color. Teal candles and background mean the tracker reads an advancing phase, red a declining phase, gray a base and orange a top.
- Check the Since and Bars in Stage rows. A young Stage 2 right after a long base is a different situation from a Stage 2 that has been running for a very long time.
- Watch the MA Slope row during Stage 2 and Stage 4. A slope moving toward the flat zone is often the first sign that the tracker may soon move to Stage 3 or Stage 1.
- Use Range High and Range Low to see how close price is to a breakout or a breakdown that would change the stage.
- Treat Stage 1 and Stage 3 as sideways phases. In stage analysis, buying in a base is described as too early: money can sit idle for a long time, and impatient buyers often sell just before the real move begins. A base can last many months or even years.
- Turn on the filters if you want the alerts to fire only when a new Stage 2 or Stage 4 has extra support: a matching higher timeframe, a trend-strength reading at or above the threshold, or, for Stage 2, expanding breakout volume.
• Timeframes
The settings panel's own guidance for the MA Length is 30 weeks for investors, 10 weeks for traders, and 30 days on a daily chart for traders. The default of 30 therefore fits a weekly chart for the investor view and a daily chart for the trader view. The default higher timeframe for confirmation is monthly.
• Alerts
Four events fire when the stage changes on a closed bar: Stage 1 Basing, Stage 2 Advancing, Stage 3 Topping and Stage 4 Declining. They are available both as standard alert conditions and through a single alert that sends a JSON message. The JSON message carries the action word, the symbol, the timeframe, a direction (bullish for Stage 2, bearish for Stage 4, neutral for Stages 1 and 3), the stage name, the stage and previous stage numbers, the price, the stage average, the slope percentage and the time. The action words default to stage1, stage2, stage3 and stage4 and can be changed in the Alerts group. These alerts report what happened. They are events, not orders.
• Repainting and live-bar behavior
Stage changes are only alerted on a closed bar. On the bar that is still forming, the stage, the candle and background colors and the dashboard are calculated from the live price and can change until that bar closes, so a stage shown on the live bar is provisional. The higher-timeframe confirmation reads the last completed higher-timeframe bar and never uses a higher-timeframe bar that has not closed yet. Because the stage is built step by step from the first bar the chart loads, the stages at the far left of the chart depend on where the loaded history begins, and a stage is only assigned once the first clear rising or falling condition is met.
⚙️ Inputs and Settings
• Core Settings
- Source: the price series the stage is read from. Close by default.
- MA Length: the length of the stage average, 30 by default. A longer length gives slower, longer-lasting stages. A shorter one reacts faster but changes stage more often.
- Slope Lookback: how many bars back the average is compared with to measure its slope, 4 by default.
- Flat Slope %: the size of the flat zone around zero slope, 0.5% by default. A wider zone keeps more bars classed as flat, which suits slow markets. A narrower zone makes the tracker react to smaller changes in direction.
- Range Lookback: how many earlier bars form the trading range used for breakouts, 30 by default.
- Volume Avg Length: the average used by the Vol vs Avg dashboard row, 20 by default. Only bars that carry volume are averaged.
• Filters
- HTF Confirmation and HTF Timeframe: off by default, with monthly as the default timeframe. The timeframe must not be lower than the chart's timeframe.
- Trend Strength Filter, ADX Threshold and ADX Length: off by default, with a threshold of 20 and a length of 14.
- Adaptive Smoothing and Smoothing Length: None by default, with a length of 5.
- Breakout Volume, Volume Multiple and Volume Lookback: off by default, with a multiple of 2.0 and a lookback of 4 bars. The settings panel's guidance notes that Weinstein asks for at least twice the average volume, measured over 4 weeks on a weekly chart.
• Visuals, Dashboard, Alerts and Colors
- Show Stage MA, Candle Coloring, Stage Background and Background Transparency control the chart drawings.
- Show Dashboard and Position control the panel, top right by default.
- Stage 1 to Stage 4 Action set the action word sent in each alert's JSON message.
- Every color is adjustable: the four stage colors, the three trend-strength bar colors, and the dashboard header, background, text and warning-row colors.
🔍 Deconstruction of the Underlying Scientific and Academic Framework
• Stage analysis as a market cycle
Stan Weinstein's stage analysis describes the full life of a stock from a bull phase to a bear phase in four observed stages. The base forms while interest is low and volume is light. The mark-up begins with a breakout, a rising average and expanding volume. The top forms when price stops responding to good news and crosses back and forth through its averages. The decline begins when price falls below its prior range and below averages that then turn down. The tracker keeps this sequence and puts it into rules. It uses one stage average, as the book does, and measures the trading range over a fixed lookback where the book reads it by eye.
• The moving average as a smoothing filter
A simple moving average is the plain average of the last n values, with each value weighted equally. It smooths out bar-to-bar noise to show the direction of the trend, at the cost of lag: the longer the length, the longer a major price change takes to show in the average. That trade-off between smoothness and responsiveness is the reason the MA Length and the optional smoothing matter so much to how early or late a stage change appears.
• Slope, rate of change and the flat zone
Comparing the average with its value several bars earlier measures its rate of change over that span. It is the discrete version of a derivative. Readings close to zero are noisy, so the tracker adds a dead band: a symmetric flat zone around zero inside which the slope counts as neither rising nor falling. In signal processing this kind of band is called a dead zone. On its own it does not stop flicker at its edges; what keeps a flat base from being chopped into false advances and declines is the stage memory and the range breakout required to change stage.
• A finite state machine with memory
The four stages and the rules between them form a finite state machine: the next state depends on both the current inputs and the current state. This is why the same combination of a flat average and price near it can mean a base after a decline and a top after an advance. A memoryless classifier, one that looks only at the current bar, cannot make that distinction.
• Breakout of a trading range
Measuring the highest high and lowest low of the preceding bars defines the boundaries of recent price action. A close beyond those boundaries is the objective counterpart of the breakout from a base that marks the start of Stage 2, and of the breakdown below a top that marks the start of Stage 4.
• Trend strength with ADX
The Average Directional Index was introduced by J. Welles Wilder, Jr. in 1978. It is built from positive and negative directional movement, normalized by the true range and smoothed with Wilder's method. It measures the strength of a trend but not its direction. Per TradingView, readings above 25 indicate a strong trend and readings below 20 a weak or absent one. As a filter, it asks that a new advancing or declining stage appear in a market that is actually trending.
• The smoothing options
- SMA: equal weight on every value in the window.
- EMA: a weighting that fades gradually with age, so the newest values count most and it reacts faster than an SMA of the same length.
- WMA: weights that step down in arithmetic progression, highest on the newest value.
- HMA: a combination of weighted moving averages designed by Alan Hull to reduce lag while staying smooth.
- RMA: Wilder's smoothing, an exponential weighting with a factor of one divided by the length.
Each option changes how much noise reaches the stage average and how much lag it adds. None is a neutral choice.
• Volume as confirmation
In the stage framework, volume jumps on the Stage 2 breakout, rises on rallies and falls on dips. Comparing the breakout bar's volume with the average of the bars just before it is a simple relative measure of that expansion. Leaving out bars with no volume keeps the average honest on feeds where many bars report nothing.
• What is not from the book
Weinstein judged a flat moving average and a trading range by eye, so this indicator uses numbers you set instead: Slope Lookback, Flat Slope % and Range Lookback. A breakout or breakdown is judged on the bar's close, not on an intrabar touch. A breakout that fails before the MA turns up returns to Stage 1, which follows the book's note that a false breakout falls back into the trading range; a failed breakdown returns to Stage 3, which is this indicator's own mirror of that rule. At the start of the chart, a stage is assigned only when the MA is clearly rising with price above it (Stage 2) or clearly falling with price at or below it (Stage 4).
• Limitations
- Every moving average lags, so stage changes are confirmed after the turn has begun, not at its exact point.
- Sideways phases can last a long time and can produce false breakouts in both directions.
- The thresholds that define flat slope and the trading range are choices, not properties of the market. Different settings will classify the same chart differently.
- The stage describes the current phase. It does not predict how long that phase will last or how far it will run.
⚠️ Disclaimer
All provided scripts and indicators are strictly for educational exploration and must not be interpreted as financial advice or a recommendation to execute trades. We expressly disclaim all liability for any financial losses or damages that may result, directly or indirectly, from the reliance on or application of these tools. Market participation carries inherent risk where past performance never guarantees future returns, leaving all investment decisions and due diligence solely at your own discretion.

💡 Proprietary indicators. Original research. Built by analysts who trade.
📢 Free Telegram: t.me/MarkitTick_Updates
👑 Premium: TradingView Marketplace
📘 Guides: markittick.com
📢 Free Telegram: t.me/MarkitTick_Updates
👑 Premium: TradingView Marketplace
📘 Guides: markittick.com
Disclaimer
The information and publications are not meant to be, and do not constitute, financial, investment, trading, or other types of advice or recommendations supplied or endorsed by TradingView. Read more in the Terms of Use.
💡 Proprietary indicators. Original research. Built by analysts who trade.
📢 Free Telegram: t.me/MarkitTick_Updates
👑 Premium: TradingView Marketplace
📘 Guides: markittick.com
📢 Free Telegram: t.me/MarkitTick_Updates
👑 Premium: TradingView Marketplace
📘 Guides: markittick.com
Disclaimer
The information and publications are not meant to be, and do not constitute, financial, investment, trading, or other types of advice or recommendations supplied or endorsed by TradingView. Read more in the Terms of Use.