OPEN-SOURCE SCRIPT
Updated Bottom Finder
・条件の収集:
高値からの調整率、
ボラティリティ(値動きの幅)、
出来高、
移動平均線、
RSI(買われ過ぎ売られ過ぎを測る指標)など、
底打ちにつながる複数の条件を、
銘柄ごとに同時に監視します。
・点数化(スコアリング):
集めた条件を「底打ちにどれくらい近いか」という観点で重み付けし、
0〜100点の総合スコアに変換します。
・3段階の見える化:
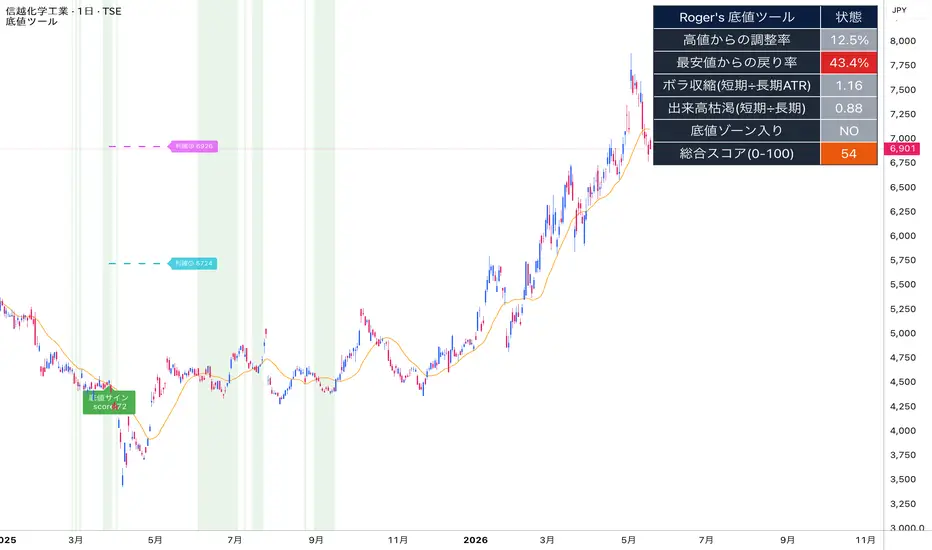
①背景が薄緑=底値ゾーン(仕込みの場)
②緑のラベル=底値サイン点灯(買い候補)
③スコア表示=接近度、この3つで画面に出します。
高値からの調整率、
ボラティリティ(値動きの幅)、
出来高、
移動平均線、
RSI(買われ過ぎ売られ過ぎを測る指標)など、
底打ちにつながる複数の条件を、
銘柄ごとに同時に監視します。
・点数化(スコアリング):
集めた条件を「底打ちにどれくらい近いか」という観点で重み付けし、
0〜100点の総合スコアに変換します。
・3段階の見える化:
①背景が薄緑=底値ゾーン(仕込みの場)
②緑のラベル=底値サイン点灯(買い候補)
③スコア表示=接近度、この3つで画面に出します。
Release Notes
・条件の収集:高値からの調整率、ボラティリティ(値動きの幅)、出来高、移動平均線、RSI(買われ過ぎ売られ過ぎを測る指標)など、底打ちにつながる複数の条件を、銘柄ごとに同時に監視します。・点数化(スコアリング):集めた条件を「底打ちにどれくらい近いか」という観点で重み付けし、0〜100点の総合スコアに変換します。
・3段階の見える化:その結果を、①背景が薄緑=底値ゾーン(仕込みの場)/②緑のラベル=底値サイン点灯(買い候補)/③スコア表示=接近度、この3つで画面に出します。
Open-source script
In true TradingView spirit, the creator of this script has made it open-source, so that traders can review and verify its functionality. Kudos to the author! While you can use it for free, remember that republishing the code is subject to our House Rules.

Disclaimer
The information and publications are not meant to be, and do not constitute, financial, investment, trading, or other types of advice or recommendations supplied or endorsed by TradingView. Read more in the Terms of Use.
Open-source script
In true TradingView spirit, the creator of this script has made it open-source, so that traders can review and verify its functionality. Kudos to the author! While you can use it for free, remember that republishing the code is subject to our House Rules.
Disclaimer
The information and publications are not meant to be, and do not constitute, financial, investment, trading, or other types of advice or recommendations supplied or endorsed by TradingView. Read more in the Terms of Use.