Updated
ADR Dashboard with Move, Left and Alerts
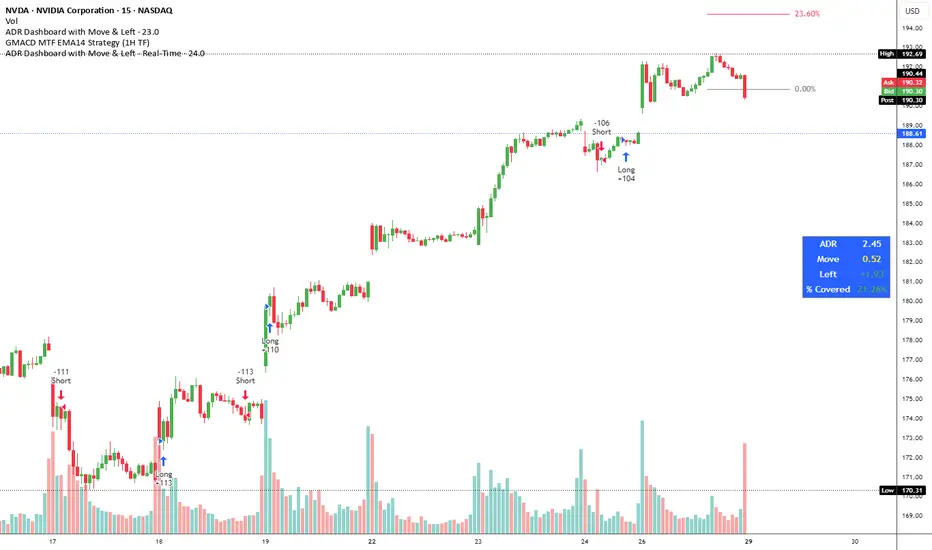
Indicator Name: ADR Dashboard with Move, Left and Alerts
Overview
The ADR Dashboard is a powerful real-time trading tool that tracks how much a stock, crypto, or other asset has moved today relative to its Average Daily Range (ADR). It provides a clear visual representation of:
1. Today’s price movement (Move)
2. Remaining potential movement left to reach ADR (Left)
3. Percentage of ADR covered (% Covered)
4.Additionally, it provides automated alerts for key movement thresholds.
A) What it Does
1.Calculates the Average Daily Range (ADR):
2. Uses True Range over a user-defined lookback period (default 14 days).
3. ADR measures typical daily volatility.
B) Tracks Today’s Move:
1. Move = Current Price – Today’s Open (Realtime)
2. Positive → bullish move, Negative → bearish move
C) Tracks Remaining Potential (Left):
1. Left = ADR – |Move| (Realtime)
2. Shows how much of the ADR is still available for today’s move
3. Percentage Covered:
4. % Covered = |Move| / ADR × 100
D) Color-coded for visual clarity:
1. Green (<50%) → small move, plenty of range left
2. Yellow (50–80%) → moderate move, watch for acceleration
3. Orange (80–100%) → strong move, ADR almost reached
4. Red (>100%) → ADR exceeded, momentum may be exhausted
E) Dashboard Table:
1. Columns: ADR | Move | Left | % Covered
2. Position: middle-right of the chart
F) Left column color-coded:
1. Green → some ADR left
2. Red → ADR fully reached or exceeded
3. Move column: usually yellow for visibility, but could be enhanced for positive/negative moves
G) Alerts
The indicator provides directional alerts:
Bullish Alerts (upward moves):
1. 90% ADR warning: fires when Move ≥ 90% of ADR → early warning of strong bullish momentum
2. 100% ADR breach: fires when Move ≥ ADR → full daily range reached
Bearish Alerts (downward moves):
1. 90% ADR warning: fires when Move ≤ -90% of ADR → early warning of strong bearish momentum
2. 100% ADR breach: fires when Move ≤ -ADR → full daily range reached
All alerts are unique and fire once per session per threshold.
H) How Traders Can Use This Indicator
Momentum Trading:
1. Identify strong intraday moves approaching ADR.
2. Enter positions early at 90% ADR warning or take profits near 100% ADR.
Scalping & Intraday Trading:
1. Gauge how much of today’s range is left for quick entries/exits.
2. Avoid trades when ADR is almost fully consumed → reduces risk of reversals.
Swing Trading:
1. Combine with trend indicators to see if today’s move is significant relative to historical volatility.
I) Risk Management:
1. Set profit targets or stop-loss levels based on Move and Left values.
Visual Efficiency:
At-a-glance view of Move, Left, % Covered, and alert status without manual calculations.
Key Features
1. Real-time Move and Left updates
2. Color-coded % Covered and Left for quick visualization
3. Alerts for 90% and 100% ADR levels, bullish and bearish
4. Clean dashboard table at middle-right of the chart
5. Works across stocks, crypto, forex, and other markets
J) Why This Indicator is Powerful
1. Combines volatility (ADR) with real-time price tracking
2. Provides visual clarity and actionable alerts
3. Helps traders stay ahead of intraday moves, manage risk, and time entries/exits effectively
Overview
The ADR Dashboard is a powerful real-time trading tool that tracks how much a stock, crypto, or other asset has moved today relative to its Average Daily Range (ADR). It provides a clear visual representation of:
1. Today’s price movement (Move)
2. Remaining potential movement left to reach ADR (Left)
3. Percentage of ADR covered (% Covered)
4.Additionally, it provides automated alerts for key movement thresholds.
A) What it Does
1.Calculates the Average Daily Range (ADR):
2. Uses True Range over a user-defined lookback period (default 14 days).
3. ADR measures typical daily volatility.
B) Tracks Today’s Move:
1. Move = Current Price – Today’s Open (Realtime)
2. Positive → bullish move, Negative → bearish move
C) Tracks Remaining Potential (Left):
1. Left = ADR – |Move| (Realtime)
2. Shows how much of the ADR is still available for today’s move
3. Percentage Covered:
4. % Covered = |Move| / ADR × 100
D) Color-coded for visual clarity:
1. Green (<50%) → small move, plenty of range left
2. Yellow (50–80%) → moderate move, watch for acceleration
3. Orange (80–100%) → strong move, ADR almost reached
4. Red (>100%) → ADR exceeded, momentum may be exhausted
E) Dashboard Table:
1. Columns: ADR | Move | Left | % Covered
2. Position: middle-right of the chart
F) Left column color-coded:
1. Green → some ADR left
2. Red → ADR fully reached or exceeded
3. Move column: usually yellow for visibility, but could be enhanced for positive/negative moves
G) Alerts
The indicator provides directional alerts:
Bullish Alerts (upward moves):
1. 90% ADR warning: fires when Move ≥ 90% of ADR → early warning of strong bullish momentum
2. 100% ADR breach: fires when Move ≥ ADR → full daily range reached
Bearish Alerts (downward moves):
1. 90% ADR warning: fires when Move ≤ -90% of ADR → early warning of strong bearish momentum
2. 100% ADR breach: fires when Move ≤ -ADR → full daily range reached
All alerts are unique and fire once per session per threshold.
H) How Traders Can Use This Indicator
Momentum Trading:
1. Identify strong intraday moves approaching ADR.
2. Enter positions early at 90% ADR warning or take profits near 100% ADR.
Scalping & Intraday Trading:
1. Gauge how much of today’s range is left for quick entries/exits.
2. Avoid trades when ADR is almost fully consumed → reduces risk of reversals.
Swing Trading:
1. Combine with trend indicators to see if today’s move is significant relative to historical volatility.
I) Risk Management:
1. Set profit targets or stop-loss levels based on Move and Left values.
Visual Efficiency:
At-a-glance view of Move, Left, % Covered, and alert status without manual calculations.
Key Features
1. Real-time Move and Left updates
2. Color-coded % Covered and Left for quick visualization
3. Alerts for 90% and 100% ADR levels, bullish and bearish
4. Clean dashboard table at middle-right of the chart
5. Works across stocks, crypto, forex, and other markets
J) Why This Indicator is Powerful
1. Combines volatility (ADR) with real-time price tracking
2. Provides visual clarity and actionable alerts
3. Helps traders stay ahead of intraday moves, manage risk, and time entries/exits effectively
Release Notes
Updated version
Disclaimer
The information and publications are not meant to be, and do not constitute, financial, investment, trading, or other types of advice or recommendations supplied or endorsed by TradingView. Read more in the Terms of Use.
Disclaimer
The information and publications are not meant to be, and do not constitute, financial, investment, trading, or other types of advice or recommendations supplied or endorsed by TradingView. Read more in the Terms of Use.