OPEN-SOURCE SCRIPT
Updated Dominant Cycle Oscillator
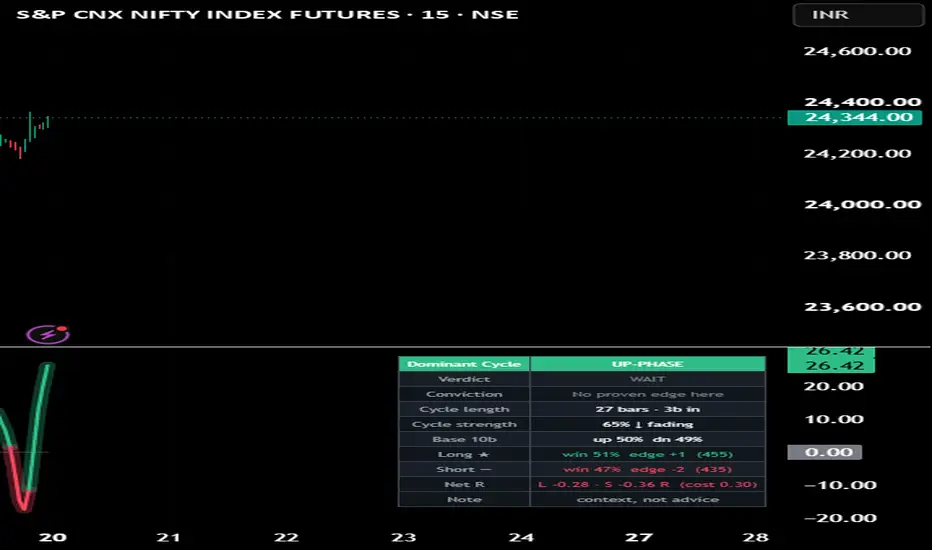
Dominant Cycle Oscillator
A cycle tool that measures the market's current dominant cycle length directly from the data — rather than assuming a fixed period — then reads where price sits inside that cycle (its phase) and how strong the cycle is (its power). It answers three things a fixed-length oscillator can't: how long the cycle is right now, where we are within it, and whether a tradable cycle even exists.
Why these parts are combined (not a mashup for show). Each is required by the previous one. A band-pass filter isolates the tradable cycle band from slow trend and fast noise — you can't measure a cycle cleanly without first removing what isn't cyclical. An autocorrelation periodogram turns that cleaned series into a power spectrum and reports the dominant period as the spectrum's centre of gravity. A cycle-strength read — how far the dominant peak stands above the spectral noise floor — says whether that period is real or noise, so signals are suppressed when no cycle exists. Forward calibration then measures whether the cycle turns actually pay on this symbol.
How it works. Band-pass (high-pass + low-lag smoother) → autocorrelation across lags → discrete Fourier transform → power spectrum → dominant period via its centre of gravity. The cleaned cycle is normalized into a ±100 phase wave. A long fires when the phase turns up from a trough with a real cycle present, a short when it turns down from a peak; each side fires at most once per swing. Every signal is labelled by a triple barrier — a profit target and equal stop in ATR units plus a time limit — split into in-sample and recent out-of-sample, with a confidence interval and a multiple-testing check.
How to use. Read the Verdict (Long/Short, Weak cycle, or Wait) and the Conviction, which reads "High" only when that turn type shows a positive edge that survives the test on this symbol — otherwise it openly says "context only" or "no proven edge here." The dashboard shows the measured cycle length and its strength. Best used with your own trend and risk plan, not alone.
Honesty & limitations. The dominant-cycle estimate is approximate and lags at regime shifts. Edge figures are computed on this chart's own history with overlapping windows and no costs — context, not a guaranteed backtest; past behaviour doesn't predict the future. Non-repainting. The periodogram is computationally heavy on deep history / very low timeframes.
Disclaimer: for research and education only. Not financial advice. Trading carries risk of loss; manage your own positions.
A cycle tool that measures the market's current dominant cycle length directly from the data — rather than assuming a fixed period — then reads where price sits inside that cycle (its phase) and how strong the cycle is (its power). It answers three things a fixed-length oscillator can't: how long the cycle is right now, where we are within it, and whether a tradable cycle even exists.
Why these parts are combined (not a mashup for show). Each is required by the previous one. A band-pass filter isolates the tradable cycle band from slow trend and fast noise — you can't measure a cycle cleanly without first removing what isn't cyclical. An autocorrelation periodogram turns that cleaned series into a power spectrum and reports the dominant period as the spectrum's centre of gravity. A cycle-strength read — how far the dominant peak stands above the spectral noise floor — says whether that period is real or noise, so signals are suppressed when no cycle exists. Forward calibration then measures whether the cycle turns actually pay on this symbol.
How it works. Band-pass (high-pass + low-lag smoother) → autocorrelation across lags → discrete Fourier transform → power spectrum → dominant period via its centre of gravity. The cleaned cycle is normalized into a ±100 phase wave. A long fires when the phase turns up from a trough with a real cycle present, a short when it turns down from a peak; each side fires at most once per swing. Every signal is labelled by a triple barrier — a profit target and equal stop in ATR units plus a time limit — split into in-sample and recent out-of-sample, with a confidence interval and a multiple-testing check.
How to use. Read the Verdict (Long/Short, Weak cycle, or Wait) and the Conviction, which reads "High" only when that turn type shows a positive edge that survives the test on this symbol — otherwise it openly says "context only" or "no proven edge here." The dashboard shows the measured cycle length and its strength. Best used with your own trend and risk plan, not alone.
Honesty & limitations. The dominant-cycle estimate is approximate and lags at regime shifts. Edge figures are computed on this chart's own history with overlapping windows and no costs — context, not a guaranteed backtest; past behaviour doesn't predict the future. Non-repainting. The periodogram is computationally heavy on deep history / very low timeframes.
Disclaimer: for research and education only. Not financial advice. Trading carries risk of loss; manage your own positions.
Release Notes
Minor updateRelease Notes
v1.1 — Calibration accuracy, performance, and a cycle-context readMore accurate short-side edge. The down-side base rate was previously approximated as 100 − up%. Because an ATR target and stop can both be touched on the same bar, that complement counted ties as "down" and understated the short edge. Down-outcomes are now counted independently, so the up and down edges are measured on identical terms. (Up% and Dn% may now sum to slightly under 100 — the small gap is the genuine tie fraction.)
Lighter and faster. The long/short branches were recomputing the exact triple barrier the base rate had already computed (same entry and ATR). They now reuse that single result, and a redundant counter in the spectrum-mean loop was removed.
New: cycle building/fading + half-cycle maturity. The dashboard now shows whether cycle strength is rising (↑ building) or falling (↓ fading), and how many bars into the current half-cycle you are (e.g. 29 bars · 4b in) — so you can see whether the rhythm is establishing or dissolving and whether a swing is early or late. Also added as a PhaseAge Data-Window export.
Attribution. Concept credit now names John Ehlers explicitly for the roofing filter / Super Smoother / autocorrelation-periodogram methods.
No changes to signals, inputs, or defaults; behaviour is otherwise identical.
Release Notes
v1.1 — Robustness + finishing pass- Robustness (important): on fresh symbols, illiquid instruments and the deep-history / low-timeframe
start, the autocorrelation periodogram didn't yet have a full window of data, so it could report a
spurious cycle and fire phase-turn signals on half-filled buffers. The script now degrades
gracefully — it shows "Warming up" and holds signals until there is enough history for the spectrum
to be meaningful. Everyday behaviour on established charts is unchanged.
- Added a Data Window (EXP_) export bus so the oscillator can feed other scripts via input.source().
- Added a cost model: a new "Round-trip cost (R)" input and a Net R row. Conviction now requires a
cycle turn to BOTH beat its base rate (Wilson) AND survive costs — a gross edge that costs eat
through is not tradeable, and the panel now says so.
- Added the MPL-2.0 licence header.
Descriptive research tooling, in-sample statistics, not investment advice.
Open-source script
In true TradingView spirit, the creator of this script has made it open-source, so that traders can review and verify its functionality. Kudos to the author! While you can use it for free, remember that republishing the code is subject to our House Rules.

Disclaimer
The information and publications are not meant to be, and do not constitute, financial, investment, trading, or other types of advice or recommendations supplied or endorsed by TradingView. Read more in the Terms of Use.
Open-source script
In true TradingView spirit, the creator of this script has made it open-source, so that traders can review and verify its functionality. Kudos to the author! While you can use it for free, remember that republishing the code is subject to our House Rules.
Disclaimer
The information and publications are not meant to be, and do not constitute, financial, investment, trading, or other types of advice or recommendations supplied or endorsed by TradingView. Read more in the Terms of Use.