Streak Reversal
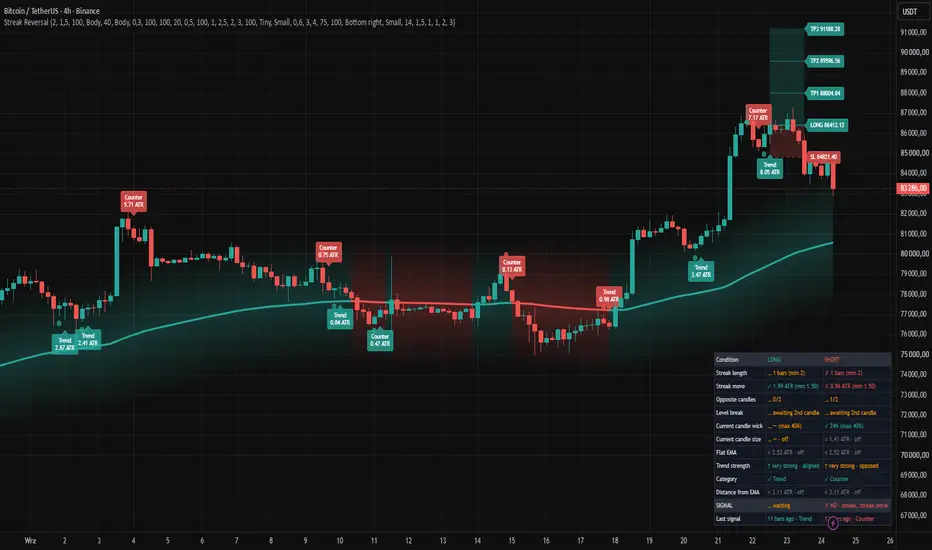
█ OVERVIEW
Streak Reversal detects potential reversals after a directional streak of same-color candles. A Long setup begins with a bearish streak followed by two consecutive bullish candles, while a Short setup begins with a bullish streak followed by two consecutive bearish candles.
The signal is generated only when the streak has reached the required length and move, the second opposite candle breaks the selected confirmation level of the first opposite candle, and all enabled candle, EMA, category, and distance filters are satisfied.
The indicator separates signals into two categories: Trend and Counter-trend. The category is determined by the position of price relative to the EMA. A Long signal above the EMA and a Short signal below the EMA are classified as Trend signals. The opposite cases are classified as Counter-trend signals.
An optional EMA movement filter can reject signals when the EMA is too flat. Additional distance filters can require Trend signals to remain sufficiently close to the EMA or Counter-trend signals to occur sufficiently far from it.
A diagnostic table continuously evaluates the current Long and Short setup separately. It shows the state of every major condition, identifies blocking conditions, displays trend strength, and reports the last signal that passed all filters.
An optional TP/SL module can plot Entry, Stop Loss, and up to three Take Profit levels. SL can be based on ATR or a fixed percentage, while TP levels are calculated from the selected Risk:Reward ratios.
█ CONCEPTS
The indicator combines candle streaks, reversal confirmation, candle structure, EMA position and movement, distance from the EMA, and optional TP/SL planning. A streak alone does not create a signal — the reversal must develop through the required sequence of candles and pass all enabled filters.
Streak Structure
A Long setup starts with a sequence of bearish candles followed by two bullish candles.
A Short setup starts with a sequence of bullish candles followed by two bearish candles.
The minimum number of same-color candles is controlled by Min. same-color candles. A doji, where close equals open, breaks the streak.
The two opposite candles are not counted as part of the original streak. They form the reversal sequence that follows it.
The signal appears on the close of the second opposite candle, provided that all other conditions are satisfied.
Streak Move
The optional Streak move filter measures whether the preceding streak covered a sufficiently large price distance relative to ATR.
For a bearish streak:
High of the first bearish candle − Low of the last bearish candle
For a bullish streak:
High of the last bullish candle − Low of the first bullish candle
The result is divided by the ATR measured at the last candle of the streak.
The minimum required value is defined by Min. streak move (ATR).
This filter is intended to distinguish a meaningful directional move from a short sequence of candles that produced only a small price displacement.
Reversal Confirmation
The second opposite candle must close beyond a level defined by the first opposite candle.
For a Long setup:
• Body — the close must break above the top edge of the first green candle's body.
• High/Low — the close must break above the first green candle's high.
For a Short setup:
• Body — the close must break below the bottom edge of the first red candle's body.
• High/Low — the close must break below the first red candle's low.
The signal therefore requires more than simply seeing two candles of the opposite color. The second candle must also confirm the reversal by breaking the selected level of the first opposite candle.
Signal Candle Filters
The signal candle can be filtered using its wick and size.
Opposite Wick Filter
For a Long signal, the indicator evaluates the upper wick of the signal candle.
For a Short signal, it evaluates the lower wick.
The wick is measured as a percentage of the candle's complete high-low range:
Wick % = Opposite wick ÷ Candle range × 100
A signal is rejected when this percentage exceeds Max. opposite wick.
The filter is designed to reject reversal candles whose structure contains an excessively large wick against the intended direction.
Candle Size Filter
The optional Candle size filter rejects confirmation candles that are too small relative to ATR.
The size can be measured as:
• Body — |Close − Open|
• Range — High − Low
The result is divided by the selected ATR and compared with Min. size (ATR).
The filter is disabled by default and can be used when very small confirmation candles are considered insufficient.
EMA Structure
The EMA determines the signal category and provides additional information about the current trend environment.
EMA length defines the moving average used by the indicator.
For Long signals:
• price ABOVE the EMA → Trend category,
• price BELOW the EMA → Counter-trend category.
For Short signals:
• price BELOW the EMA → Trend category,
• price ABOVE the EMA → Counter-trend category.
If the close is exactly equal to the EMA, both Long and Short setups are classified as Counter-trend.
Trend and Counter-trend categories can be enabled or disabled independently.
Trend signals therefore represent reversals that occur in the same directional context as the EMA position, while Counter-trend signals occur against that context.
Flat EMA Filter
The optional Flat EMA filter measures how much the EMA moved during the selected window.
EMA Move = Highest EMA − Lowest EMA
This value is divided by ATR to express the EMA movement in ATR units.
If the resulting value is below Min. EMA move (ATR), the signal is rejected.
This filter is shared by Long and Short signals.
Trend Strength
The table also evaluates the EMA movement as an informational trend-strength reading.
The EMA movement is classified using the selected thresholds:
• below Strong trend threshold → weak,
• at or above Strong trend threshold → strong,
• at or above Very strong trend threshold → very strong.
The EMA direction (↑ or ↓) is determined separately, by comparing the current EMA value with its value at the start of the EMA move window.
The table also indicates whether the EMA direction is aligned with the signal side (Long or Short).
For example:
• Long + rising EMA → aligned,
• Long + falling EMA → opposed,
• Short + falling EMA → aligned,
• Short + rising EMA → opposed.
When the trend is weak, the table shows "(flat)" instead of the aligned/opposed status.
This rating is informational only. It does not block a signal.
Distance from EMA
The distance between the current close and the EMA is measured in ATR:
Distance = |Close − EMA| ÷ ATR
Two independent filters can use this value.
Trend signals can use a maximum distance filter. A Trend signal is rejected when price is too far from the EMA.
Counter-trend signals can use a minimum distance filter. A Counter-trend signal is rejected when price is too close to the EMA.
This creates two different interpretations of EMA distance:
• Trend — preferably not excessively extended from the EMA.
• Counter-trend — preferably sufficiently extended from the EMA.
The distance value is also displayed in the signal label.
Signal Types
Every valid signal belongs to one of four types:
• Long Trend — bearish streak → bullish reversal above EMA.
• Long Counter — bearish streak → bullish reversal below EMA.
• Short Trend — bullish streak → bearish reversal below EMA.
• Short Counter — bullish streak → bearish reversal above EMA.
Triangles represent Trend signals.
Diamonds represent Counter-trend signals.
The optional signal labels show the category and the current distance from the EMA in ATR.
Signal Table
The table is a real-time diagnostic checklist for the current bar. It evaluates Long and Short independently and shows how close each direction is to producing a valid signal.
The table contains:
• Condition — the condition being evaluated,
• LONG — status and value for a Long setup,
• SHORT — status and value for a Short setup.
The status symbols mean:
✓ — condition is satisfied.
✗ — condition currently blocks the signal.
… — the condition cannot yet be finalized because more candles are required.
○ — the corresponding filter is disabled and therefore does not block the signal.
The table does not simply show whether a signal exists. It shows the individual components that lead to that result.
Streak length
Shows the length of the streak preceding the reversal.
For Long, this is the preceding bearish/red streak.
For Short, this is the preceding bullish/green streak.
The value is compared with Min. same-color candles.
When the streak is still running, the table can display … because its final length may still increase.
Streak move
Shows the price distance covered by the same streak, expressed in ATR.
It is compared with Min. streak move (ATR).
When the streak is still developing, a value below the minimum is shown as waiting rather than immediately treated as a final failure, because the move can still increase.
Opposite candles
Shows how many opposite-color candles have appeared after the streak.
The required sequence is 2/2.
For Long:
bearish streak → green candle → green candle.
For Short:
bullish streak → red candle → red candle.
The signal can only form on the close of the second opposite candle.
Level break
Shows whether the close of the second opposite candle has broken the confirmation level of the first opposite candle.
The exact level depends on Confirmation level:
• Body — body edge,
• High/Low — high for Long or low for Short.
Before the second opposite candle exists, the table shows that it is still awaiting confirmation.
Current candle wick
Shows the relevant wick of the current candle as a percentage of its complete range.
For Long, the relevant wick is the upper wick.
For Short, the relevant wick is the lower wick.
When the current candle is not the required opposite color, the condition is not yet applicable.
When the second opposite candle is present, this becomes the decisive wick value for the signal.
Current candle size
Shows the size of the current candle in ATR.
Depending on Measure size as, this is either:
• the candle body, or
• the complete high-low range.
The table compares the value with Min. size (ATR) when the Candle size filter is enabled.
Flat EMA
Shows the EMA movement over EMA move window, expressed in ATR.
The value is compared with Min. EMA move (ATR) when the Flat EMA filter is enabled.
Because this condition is shared, the same EMA movement is evaluated for both Long and Short.
Trend strength
Shows the EMA direction and its current strength.
The table displays:
• ↑ or ↓ — EMA direction,
• weak / strong / very strong — EMA movement strength,
• aligned / opposed — whether that EMA direction agrees with the current signal side; for a weak trend, "(flat)" is shown instead.
This row is informational only and never blocks a signal.
Category
Shows whether the current Long or Short setup belongs to the Trend or Counter category and whether that category is enabled.
The classification is based on the current close relative to the EMA.
If the relevant category is disabled in the Signals settings, the table marks it as blocking.
Distance from EMA
Shows the current close's distance from the EMA in ATR.
The applicable filter depends on the signal category:
• Trend → maximum allowed distance,
• Counter → minimum required distance.
If the corresponding filter is disabled, the cell shows ○.
Signal
The SIGNAL row summarizes the current state after evaluating the blocking conditions.
Possible states include:
YES · Trend
YES · Counter
NO · followed by the blocking conditions.
waiting
off — the direction is disabled in the Signals settings.
When a signal is blocked, the table lists the blocking conditions. Up to two are displayed directly in the cell, while additional conditions are represented as +N. Hovering over the cell shows the complete list.
When no condition is currently blocking the setup but additional candles are still required, the result is shown as waiting.
The Long and Short columns are evaluated independently, so it is possible for one side to be blocked while the other is still waiting or already confirmed.
Last signal
Shows the most recent Long or Short signal that passed all filters and was generated by the indicator, regardless of whether shapes or labels are displayed.
Blocked setups are not counted as signals.
The table also identifies whether that last signal was Trend or Counter.
Signal Labels and Shapes
The optional signal shapes use different symbols for the two categories:
• ▲ / ▼ triangle — Trend signal.
• ◆ diamond — Counter-trend signal.
An optional circle marks the first opposite candle — the candle whose confirmation level was broken by the second opposite candle. The circle is plotted retroactively on that candle once a valid signal is confirmed.
The signal label contains:
• Trend or Counter,
• distance from the EMA in ATR.
The label's vertical offset is independently adjustable using ATR.
EMA and Glow
The EMA changes color according to the current price position.
When price is above the EMA, the bullish color is used.
When price is below the EMA, the bearish color is used.
The optional glow creates a gradient around the EMA. Its width is based on ATR and its transparency can be adjusted independently.
TP/SL
After a signal, the TP/SL module plots Entry, Stop Loss, and up to three Take Profit levels.
Entry is the close of the signal candle.
Stop Loss can be calculated in two ways:
- ATR-based: SL distance = ATR × SL ATR multiplier
- Percentage-based: SL distance = Entry × SL % ÷ 100
The Take Profit levels are calculated from the Entry-to-SL distance:
TP1 = Entry ± Risk × TP1 Risk:Reward
TP2 = Entry ± Risk × TP2 Risk:Reward
TP3 = Entry ± Risk × TP3 Risk:Reward
The direction depends on whether the signal is Long or Short.
A new signal removes the previous TP/SL set and creates a new one.
The levels extend with price until either the Stop Loss or the farthest visible Take Profit is reached. At that point, the active TP/SL set stops extending.
█ FEATURES
• Reversal detection after a configurable streak of same-color candles.
• Separate Long and Short reversal conditions.
• Minimum streak length filter with doji-based streak termination.
• Optional minimum streak movement measured in ATR.
• Two-candle reversal confirmation.
• Confirmation based on either the first opposite candle's body or High/Low.
• Optional opposite-wick filter.
• Optional signal-candle size filter based on Body or Range.
• EMA-based Trend and Counter-trend signal classification.
• Independent enabling/disabling of Trend and Counter-trend signals.
• Optional Flat EMA filter.
• Informational EMA trend-strength rating: weak, strong, very strong.
• Trend-alignment information in the diagnostic table.
• Optional maximum EMA distance for Trend signals.
• Optional minimum EMA distance for Counter-trend signals.
• Configurable bullish and bearish colors.
• Optional signal triangles and diamonds.
• Optional marker for the first opposite candle.
• Signal labels showing category and EMA distance in ATR.
• Configurable EMA line and ATR-based glow.
• Diagnostic Long/Short table with condition-by-condition status.
• Table result showing blocking conditions and waiting state.
• Last valid Long/Short signal tracking.
• Optional Entry, SL, TP1, TP2 and TP3 levels.
• ATR-based or percentage-based Stop Loss.
• Independent Risk:Reward settings for TP1-TP3.
• Optional display of individual SL and TP levels.
• Risk and reward zone visualization.
• Four hidden outputs for external backtesting.
• Alerts for all signals, Long/Short signals, and Trend/Counter variants.
█ APPLICATIONS
Reversal Analysis
The indicator can be used to study reversals that develop after an identifiable directional candle streak rather than treating every opposite-colored candle as a reversal.
The combination of streak length, streak movement, and the two-candle confirmation creates a structured sequence:
Directional streak → first opposite candle → second opposite candle → confirmation.
EMA Extension Analysis
The distance from EMA can be used to distinguish between two different situations.
A Trend signal can be filtered when price has moved too far away from the EMA.
A Counter-trend signal can instead require price to be sufficiently far from the EMA.
The EMA distance displayed on each signal label also provides a direct reference for comparing how extended different signals were.
Signal Quality Filtering
The candle filters allow the reversal definition to be made stricter.
For example, the streak-move filter can require a sufficiently large preceding move, while the wick filter can reject confirmation candles with an excessive opposite wick.
The candle-size filter can additionally exclude very small confirmation candles.
These filters can be combined or disabled independently depending on how selective the strategy should be.
Example of Use
A Streak Reversal signal is better treated as a structured event rather than an automatic trade instruction.
Before acting on a signal, it can be useful to consider:
• the length and size of the preceding streak,
• the strength and direction of the EMA,
• whether the signal is Trend or Counter,
• the distance from the EMA,
• the structure of the confirmation candle,
• the market's broader price structure,
• support and resistance,
• momentum and higher-timeframe context.
The table is particularly useful for diagnosing why a setup is not producing a signal. Instead of waiting for a triangle or diamond, the user can see which individual condition is currently preventing the Long or Short setup.
The TP/SL module can then be used to visualize a predefined risk/reward structure and inspect how different SL and Risk:Reward settings would be positioned relative to the signal.
█ NOTES
• Signals are calculated on the close of the second opposite candle. On the realtime bar, the signal, its label, TP/SL levels and alerts may appear and disappear until the bar closes. On historical bars, signals reflect closed candles only.
• Trend strength in the table is informational only and does not block signals.
• TP/SL is a visual level-planning tool and does not assess the quality of a signal.
• This indicator does not replace independent market analysis or risk management.
Streak Reversal detects potential reversals after a directional streak of same-color candles. A Long setup begins with a bearish streak followed by two consecutive bullish candles, while a Short setup begins with a bullish streak followed by two consecutive bearish candles.
The signal is generated only when the streak has reached the required length and move, the second opposite candle breaks the selected confirmation level of the first opposite candle, and all enabled candle, EMA, category, and distance filters are satisfied.
The indicator separates signals into two categories: Trend and Counter-trend. The category is determined by the position of price relative to the EMA. A Long signal above the EMA and a Short signal below the EMA are classified as Trend signals. The opposite cases are classified as Counter-trend signals.
An optional EMA movement filter can reject signals when the EMA is too flat. Additional distance filters can require Trend signals to remain sufficiently close to the EMA or Counter-trend signals to occur sufficiently far from it.
A diagnostic table continuously evaluates the current Long and Short setup separately. It shows the state of every major condition, identifies blocking conditions, displays trend strength, and reports the last signal that passed all filters.
An optional TP/SL module can plot Entry, Stop Loss, and up to three Take Profit levels. SL can be based on ATR or a fixed percentage, while TP levels are calculated from the selected Risk:Reward ratios.
█ CONCEPTS
The indicator combines candle streaks, reversal confirmation, candle structure, EMA position and movement, distance from the EMA, and optional TP/SL planning. A streak alone does not create a signal — the reversal must develop through the required sequence of candles and pass all enabled filters.
Streak Structure
A Long setup starts with a sequence of bearish candles followed by two bullish candles.
A Short setup starts with a sequence of bullish candles followed by two bearish candles.
The minimum number of same-color candles is controlled by Min. same-color candles. A doji, where close equals open, breaks the streak.
The two opposite candles are not counted as part of the original streak. They form the reversal sequence that follows it.
The signal appears on the close of the second opposite candle, provided that all other conditions are satisfied.
Streak Move
The optional Streak move filter measures whether the preceding streak covered a sufficiently large price distance relative to ATR.
For a bearish streak:
High of the first bearish candle − Low of the last bearish candle
For a bullish streak:
High of the last bullish candle − Low of the first bullish candle
The result is divided by the ATR measured at the last candle of the streak.
The minimum required value is defined by Min. streak move (ATR).
This filter is intended to distinguish a meaningful directional move from a short sequence of candles that produced only a small price displacement.
Reversal Confirmation
The second opposite candle must close beyond a level defined by the first opposite candle.
For a Long setup:
• Body — the close must break above the top edge of the first green candle's body.
• High/Low — the close must break above the first green candle's high.
For a Short setup:
• Body — the close must break below the bottom edge of the first red candle's body.
• High/Low — the close must break below the first red candle's low.
The signal therefore requires more than simply seeing two candles of the opposite color. The second candle must also confirm the reversal by breaking the selected level of the first opposite candle.
Signal Candle Filters
The signal candle can be filtered using its wick and size.
Opposite Wick Filter
For a Long signal, the indicator evaluates the upper wick of the signal candle.
For a Short signal, it evaluates the lower wick.
The wick is measured as a percentage of the candle's complete high-low range:
Wick % = Opposite wick ÷ Candle range × 100
A signal is rejected when this percentage exceeds Max. opposite wick.
The filter is designed to reject reversal candles whose structure contains an excessively large wick against the intended direction.
Candle Size Filter
The optional Candle size filter rejects confirmation candles that are too small relative to ATR.
The size can be measured as:
• Body — |Close − Open|
• Range — High − Low
The result is divided by the selected ATR and compared with Min. size (ATR).
The filter is disabled by default and can be used when very small confirmation candles are considered insufficient.
EMA Structure
The EMA determines the signal category and provides additional information about the current trend environment.
EMA length defines the moving average used by the indicator.
For Long signals:
• price ABOVE the EMA → Trend category,
• price BELOW the EMA → Counter-trend category.
For Short signals:
• price BELOW the EMA → Trend category,
• price ABOVE the EMA → Counter-trend category.
If the close is exactly equal to the EMA, both Long and Short setups are classified as Counter-trend.
Trend and Counter-trend categories can be enabled or disabled independently.
Trend signals therefore represent reversals that occur in the same directional context as the EMA position, while Counter-trend signals occur against that context.
Flat EMA Filter
The optional Flat EMA filter measures how much the EMA moved during the selected window.
EMA Move = Highest EMA − Lowest EMA
This value is divided by ATR to express the EMA movement in ATR units.
If the resulting value is below Min. EMA move (ATR), the signal is rejected.
This filter is shared by Long and Short signals.
Trend Strength
The table also evaluates the EMA movement as an informational trend-strength reading.
The EMA movement is classified using the selected thresholds:
• below Strong trend threshold → weak,
• at or above Strong trend threshold → strong,
• at or above Very strong trend threshold → very strong.
The EMA direction (↑ or ↓) is determined separately, by comparing the current EMA value with its value at the start of the EMA move window.
The table also indicates whether the EMA direction is aligned with the signal side (Long or Short).
For example:
• Long + rising EMA → aligned,
• Long + falling EMA → opposed,
• Short + falling EMA → aligned,
• Short + rising EMA → opposed.
When the trend is weak, the table shows "(flat)" instead of the aligned/opposed status.
This rating is informational only. It does not block a signal.
Distance from EMA
The distance between the current close and the EMA is measured in ATR:
Distance = |Close − EMA| ÷ ATR
Two independent filters can use this value.
Trend signals can use a maximum distance filter. A Trend signal is rejected when price is too far from the EMA.
Counter-trend signals can use a minimum distance filter. A Counter-trend signal is rejected when price is too close to the EMA.
This creates two different interpretations of EMA distance:
• Trend — preferably not excessively extended from the EMA.
• Counter-trend — preferably sufficiently extended from the EMA.
The distance value is also displayed in the signal label.
Signal Types
Every valid signal belongs to one of four types:
• Long Trend — bearish streak → bullish reversal above EMA.
• Long Counter — bearish streak → bullish reversal below EMA.
• Short Trend — bullish streak → bearish reversal below EMA.
• Short Counter — bullish streak → bearish reversal above EMA.
Triangles represent Trend signals.
Diamonds represent Counter-trend signals.
The optional signal labels show the category and the current distance from the EMA in ATR.
Signal Table
The table is a real-time diagnostic checklist for the current bar. It evaluates Long and Short independently and shows how close each direction is to producing a valid signal.
The table contains:
• Condition — the condition being evaluated,
• LONG — status and value for a Long setup,
• SHORT — status and value for a Short setup.
The status symbols mean:
✓ — condition is satisfied.
✗ — condition currently blocks the signal.
… — the condition cannot yet be finalized because more candles are required.
○ — the corresponding filter is disabled and therefore does not block the signal.
The table does not simply show whether a signal exists. It shows the individual components that lead to that result.
Streak length
Shows the length of the streak preceding the reversal.
For Long, this is the preceding bearish/red streak.
For Short, this is the preceding bullish/green streak.
The value is compared with Min. same-color candles.
When the streak is still running, the table can display … because its final length may still increase.
Streak move
Shows the price distance covered by the same streak, expressed in ATR.
It is compared with Min. streak move (ATR).
When the streak is still developing, a value below the minimum is shown as waiting rather than immediately treated as a final failure, because the move can still increase.
Opposite candles
Shows how many opposite-color candles have appeared after the streak.
The required sequence is 2/2.
For Long:
bearish streak → green candle → green candle.
For Short:
bullish streak → red candle → red candle.
The signal can only form on the close of the second opposite candle.
Level break
Shows whether the close of the second opposite candle has broken the confirmation level of the first opposite candle.
The exact level depends on Confirmation level:
• Body — body edge,
• High/Low — high for Long or low for Short.
Before the second opposite candle exists, the table shows that it is still awaiting confirmation.
Current candle wick
Shows the relevant wick of the current candle as a percentage of its complete range.
For Long, the relevant wick is the upper wick.
For Short, the relevant wick is the lower wick.
When the current candle is not the required opposite color, the condition is not yet applicable.
When the second opposite candle is present, this becomes the decisive wick value for the signal.
Current candle size
Shows the size of the current candle in ATR.
Depending on Measure size as, this is either:
• the candle body, or
• the complete high-low range.
The table compares the value with Min. size (ATR) when the Candle size filter is enabled.
Flat EMA
Shows the EMA movement over EMA move window, expressed in ATR.
The value is compared with Min. EMA move (ATR) when the Flat EMA filter is enabled.
Because this condition is shared, the same EMA movement is evaluated for both Long and Short.
Trend strength
Shows the EMA direction and its current strength.
The table displays:
• ↑ or ↓ — EMA direction,
• weak / strong / very strong — EMA movement strength,
• aligned / opposed — whether that EMA direction agrees with the current signal side; for a weak trend, "(flat)" is shown instead.
This row is informational only and never blocks a signal.
Category
Shows whether the current Long or Short setup belongs to the Trend or Counter category and whether that category is enabled.
The classification is based on the current close relative to the EMA.
If the relevant category is disabled in the Signals settings, the table marks it as blocking.
Distance from EMA
Shows the current close's distance from the EMA in ATR.
The applicable filter depends on the signal category:
• Trend → maximum allowed distance,
• Counter → minimum required distance.
If the corresponding filter is disabled, the cell shows ○.
Signal
The SIGNAL row summarizes the current state after evaluating the blocking conditions.
Possible states include:
YES · Trend
YES · Counter
NO · followed by the blocking conditions.
waiting
off — the direction is disabled in the Signals settings.
When a signal is blocked, the table lists the blocking conditions. Up to two are displayed directly in the cell, while additional conditions are represented as +N. Hovering over the cell shows the complete list.
When no condition is currently blocking the setup but additional candles are still required, the result is shown as waiting.
The Long and Short columns are evaluated independently, so it is possible for one side to be blocked while the other is still waiting or already confirmed.
Last signal
Shows the most recent Long or Short signal that passed all filters and was generated by the indicator, regardless of whether shapes or labels are displayed.
Blocked setups are not counted as signals.
The table also identifies whether that last signal was Trend or Counter.
Signal Labels and Shapes
The optional signal shapes use different symbols for the two categories:
• ▲ / ▼ triangle — Trend signal.
• ◆ diamond — Counter-trend signal.
An optional circle marks the first opposite candle — the candle whose confirmation level was broken by the second opposite candle. The circle is plotted retroactively on that candle once a valid signal is confirmed.
The signal label contains:
• Trend or Counter,
• distance from the EMA in ATR.
The label's vertical offset is independently adjustable using ATR.
EMA and Glow
The EMA changes color according to the current price position.
When price is above the EMA, the bullish color is used.
When price is below the EMA, the bearish color is used.
The optional glow creates a gradient around the EMA. Its width is based on ATR and its transparency can be adjusted independently.
TP/SL
After a signal, the TP/SL module plots Entry, Stop Loss, and up to three Take Profit levels.
Entry is the close of the signal candle.
Stop Loss can be calculated in two ways:
- ATR-based: SL distance = ATR × SL ATR multiplier
- Percentage-based: SL distance = Entry × SL % ÷ 100
The Take Profit levels are calculated from the Entry-to-SL distance:
TP1 = Entry ± Risk × TP1 Risk:Reward
TP2 = Entry ± Risk × TP2 Risk:Reward
TP3 = Entry ± Risk × TP3 Risk:Reward
The direction depends on whether the signal is Long or Short.
A new signal removes the previous TP/SL set and creates a new one.
The levels extend with price until either the Stop Loss or the farthest visible Take Profit is reached. At that point, the active TP/SL set stops extending.
█ FEATURES
• Reversal detection after a configurable streak of same-color candles.
• Separate Long and Short reversal conditions.
• Minimum streak length filter with doji-based streak termination.
• Optional minimum streak movement measured in ATR.
• Two-candle reversal confirmation.
• Confirmation based on either the first opposite candle's body or High/Low.
• Optional opposite-wick filter.
• Optional signal-candle size filter based on Body or Range.
• EMA-based Trend and Counter-trend signal classification.
• Independent enabling/disabling of Trend and Counter-trend signals.
• Optional Flat EMA filter.
• Informational EMA trend-strength rating: weak, strong, very strong.
• Trend-alignment information in the diagnostic table.
• Optional maximum EMA distance for Trend signals.
• Optional minimum EMA distance for Counter-trend signals.
• Configurable bullish and bearish colors.
• Optional signal triangles and diamonds.
• Optional marker for the first opposite candle.
• Signal labels showing category and EMA distance in ATR.
• Configurable EMA line and ATR-based glow.
• Diagnostic Long/Short table with condition-by-condition status.
• Table result showing blocking conditions and waiting state.
• Last valid Long/Short signal tracking.
• Optional Entry, SL, TP1, TP2 and TP3 levels.
• ATR-based or percentage-based Stop Loss.
• Independent Risk:Reward settings for TP1-TP3.
• Optional display of individual SL and TP levels.
• Risk and reward zone visualization.
• Four hidden outputs for external backtesting.
• Alerts for all signals, Long/Short signals, and Trend/Counter variants.
█ APPLICATIONS
Reversal Analysis
The indicator can be used to study reversals that develop after an identifiable directional candle streak rather than treating every opposite-colored candle as a reversal.
The combination of streak length, streak movement, and the two-candle confirmation creates a structured sequence:
Directional streak → first opposite candle → second opposite candle → confirmation.
EMA Extension Analysis
The distance from EMA can be used to distinguish between two different situations.
A Trend signal can be filtered when price has moved too far away from the EMA.
A Counter-trend signal can instead require price to be sufficiently far from the EMA.
The EMA distance displayed on each signal label also provides a direct reference for comparing how extended different signals were.
Signal Quality Filtering
The candle filters allow the reversal definition to be made stricter.
For example, the streak-move filter can require a sufficiently large preceding move, while the wick filter can reject confirmation candles with an excessive opposite wick.
The candle-size filter can additionally exclude very small confirmation candles.
These filters can be combined or disabled independently depending on how selective the strategy should be.
Example of Use
A Streak Reversal signal is better treated as a structured event rather than an automatic trade instruction.
Before acting on a signal, it can be useful to consider:
• the length and size of the preceding streak,
• the strength and direction of the EMA,
• whether the signal is Trend or Counter,
• the distance from the EMA,
• the structure of the confirmation candle,
• the market's broader price structure,
• support and resistance,
• momentum and higher-timeframe context.
The table is particularly useful for diagnosing why a setup is not producing a signal. Instead of waiting for a triangle or diamond, the user can see which individual condition is currently preventing the Long or Short setup.
The TP/SL module can then be used to visualize a predefined risk/reward structure and inspect how different SL and Risk:Reward settings would be positioned relative to the signal.
█ NOTES
• Signals are calculated on the close of the second opposite candle. On the realtime bar, the signal, its label, TP/SL levels and alerts may appear and disappear until the bar closes. On historical bars, signals reflect closed candles only.
• Trend strength in the table is informational only and does not block signals.
• TP/SL is a visual level-planning tool and does not assess the quality of a signal.
• This indicator does not replace independent market analysis or risk management.

Disclaimer
The information and publications are not meant to be, and do not constitute, financial, investment, trading, or other types of advice or recommendations supplied or endorsed by TradingView. Read more in the Terms of Use.
Disclaimer
The information and publications are not meant to be, and do not constitute, financial, investment, trading, or other types of advice or recommendations supplied or endorsed by TradingView. Read more in the Terms of Use.